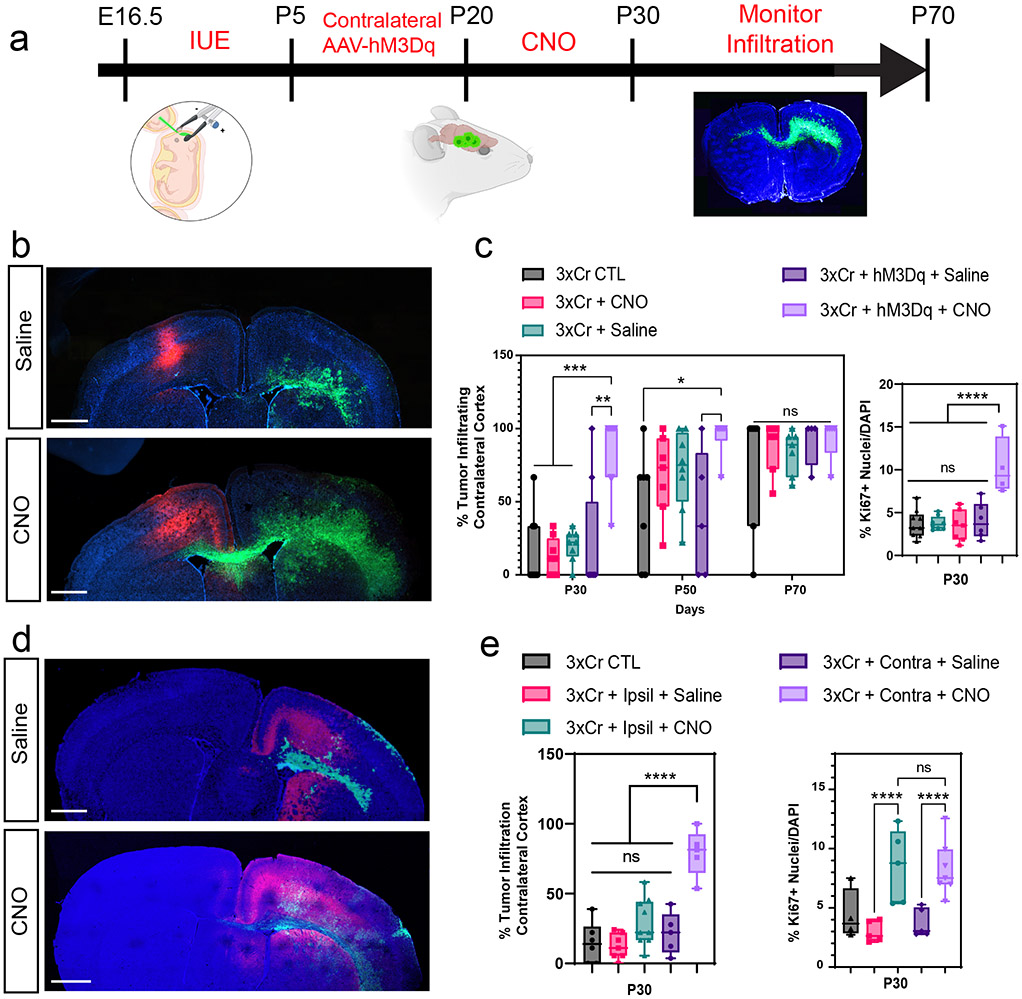
Figure 1. Remote neuronal stimulation accelerates glioma progression.
a. Schematic of DREADD-based activation of neurons contralateral to IUE tumor. b. Representative images from IUE-HGG tumors at P30 after contralateral activation or control; green is tumor, red is AAV-DREADD virus. c. Quantification of infiltration and Ki67 expression via two-way ANOVA analysis. Analysis of infiltration derived from P30 CTL n = 8, P50 CTL n = 7, P70 CTL n = 7, P30+CNO n = 8, P50+CNO n = 7, P70+CNO n = 7, P30+Saline n = 8, P50+Saline n = 7, P70+Saline n = 7, P30+AAV+Saline n = 8, P50+AAV+Saline n = 5, P30+AAV+Saline n = 4, P30+AAV+CNO n = 8, P50+AAV+CNO n = 6, P30+AAV+CNO n = 5 samples. (***P=0.0001, *P=0.0107). Ki67 staining was performed at the P30 time point, from CTL n = 9, CNO-only n = 8, Saline n = 7, AAV+Saline n = 5, AAV+CNO n = 4 samples (****P<0.0001). d. Representative images from IUE-HGG tumors at P30 after ipsilateral neuronal activation; green is tumor, red is AAV-DREADD virus. e. Quantification of infiltration and Ki67 expression at P30 via two-way ANOVA. Analysis is derived from 3xCr CTL n = 6, 3xCr+IpsilAAV+Saline n=7, 3xCr+IpsilAAV+CNO n=9. CNO stimulated brains revealed no statistical difference with Saline treated (P=0.1247) or control tumors (P=0.2714). Comparison between ipsilateral-CNO and contralateral-CNO groups revealed a statistically significant difference (****P=0.0001). Ki67 staining was performed on 3xCr CTL n=5, 3xCr+IpsilAAV+Saline n=5, 3xCr+IpsilAAV+CNO n=5 (****P<0.0001, ***P=0.0003); Data are plotted as median (center line), IQR (box limits) and minimum and maximum values (whiskers) (c, e). Scale bars are 1000um.

