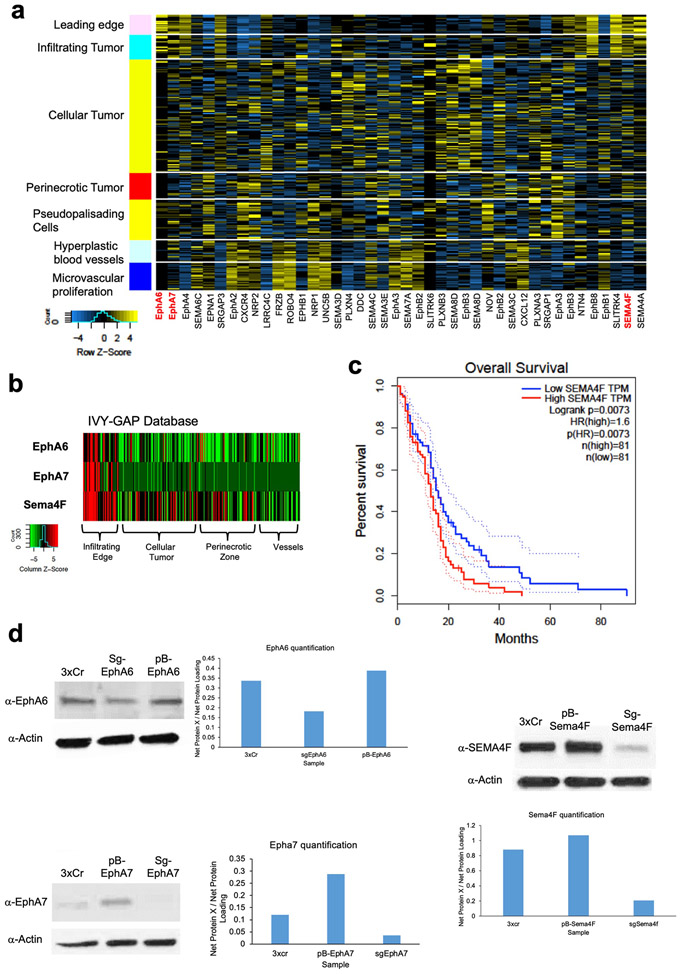
Extended Data Figure 5. Expression characteristics of EphA6, EphA7, and Sema4F.
a. Heatmap of IVY-GAP expression data of all axon guidance genes included in the bar coded screen described in main figure 4a. b. Heatmap of IVY-GAP expression data for Sema4f, EphA6, EphA7. c. KM curve of GEPIA survival data. GBM patient cohort data were split based on high and low Sema4F expression. d. Western blots of wild type, GOF, and LOF tumors. (pBSema4F is GOF; sgSema4F is LOF). Antibodies and concentrations used are described in methods. Western blots were quantified in ImageJ. Western blots were performed on biological replicates (2 additional tumor sample) to ensure reproducibility.

