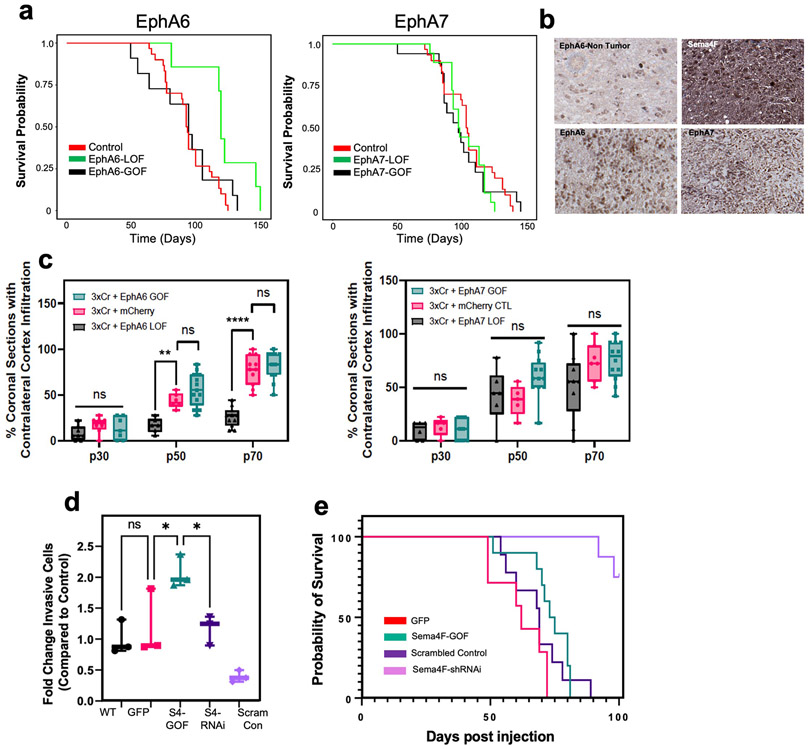
Extended Data Figure 6. Analysis of EphA6, EphA7, and Sema4F GOF/LOF tumors.
a. Kaplan-Meier survival curve of individual gain-of-function and loss-of-function validation studies for EphA6 and EphA7. EphA6-GOF (medianA6GOF = 105 days, Chisq = 0.7, df=1, p-value =0.4, n=11), EphA6-LOF (medianA6LOF = 133days, Chis =7.2, df=1, p-value=0.007, n = 7), EphA7-GOF (medianA7GOF= 97 days, Chisq=0, df=1 p-value=0.9, n=15), EphA7-LOF (medianA7LOF= 97.5 days, Chisq=1.3, df=1, p-value=0.3). b. Representative immunostainings of EphA6, EphA7, and Sema4F human tumor micro-array. c. Quantification of infiltration from these tumors across the P30-P70 timecourse. Infiltration was quantified based on the presence of tumor cells in contralateral cortex and analyzed via two-way analysis of variance (ANOVA). Error bars represent standard deviation, data derived from EphA6-GOF p30 n=7, EphA6-GOF p50 n=13, EphA6-GOF p70 n=11, EphA6 CTL p30 n=8, EphA6 CTL p50 n=6, EphA6 CTL p70 n=11, EphA6-LOF p30 n=8, EphA6-LOF p50 n=6, EphA6-LOF p70 n=11, EphA7-GOF p30 n=9, EphA7-GOF p50 n=12, EphA7-GOF p70 n=12, EphA7 CTL p30 n=5, EphA7 CTL p50 n=5, EphA7 CTL p70 n=7, EphA7-LOF p30 n=6, EphA7-LOF p50 n=6, EphA7-LOF p70 n=9. d. Quantification of transwell migration of human glioma cell lines; infiltrating cells were counted after 48 hours incubation (n=3 wells per condition). e. Kaplan-Meier survival curve for human glioma cell lines transplanted into mouse brain. Samples were analyzed via log-rank (Mantel-Cox) test. WT median survival=66 days, n=11; GFP median=62 days n=7; Sema4f-GOF median=74 days, n=10, Chi = 0.4120, p-value = 0.5209; shSCR median=69 days, n=9; shSema4F median = undefined after 100 days, n=8, Chi = 14.08 p-value = 0.0002. *P < 0.05, **P < 0.01, ***P < 0.001, **** P < 0.0001, two-way analysis of variance (ANOVA) (c), one-way analysis of variance (ANOVA) (f), Log-rank (Mantel-Cox) test (a,d). Data are plotted as median (center line), IQR (box limits) and minimum and maximum values (whiskers) (c-d).

