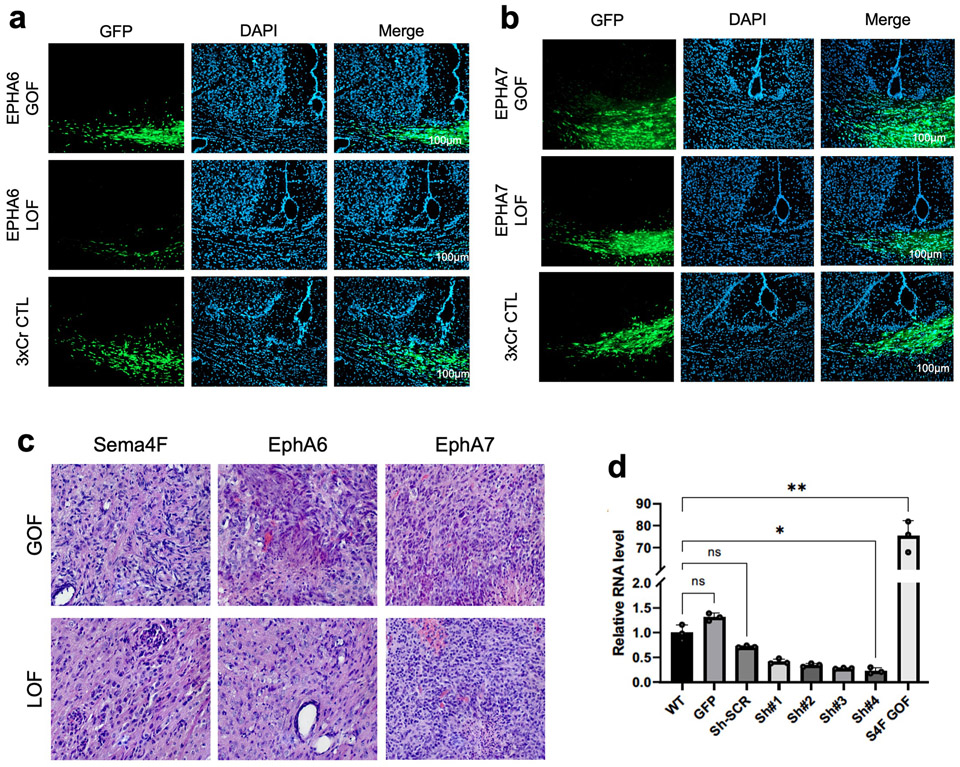
Extended Data Figure 7. Infiltrating glioma from EphA6 and EphA7 GOF/LOF tumors.
a. Representative images of IUE-HGG GOF/LOF/CTL of EphA6 in P50 mice. Frozen sections were stained with Hoechst and native GFP was assessed for infiltration status into the contralateral cortex. b. Representative images of IUE-HGG GOF/LOF/CTL of Epha7 in P50 mice. Samples assessed as outlined above (EphA6-GOF p50 n=13, EphA6 CTL p50 n=6, EphA6-LOF p50 n=6, EphA7-GOF p50 n=12, EphA7 CTL p50 n=5, EphA7-LOF p50 n=6) (a,b). c. Representative H&E staining of IUE-HGG tumors containing GOF and LOF of EphA6, EphA7, and Sema 4F. All tumors demonstrated high-grade characteristics such as microvascular proliferation or necrosis regardless of GOF or LOF. H&E staining repeated on n=4 tumor samples per condition d. qRT-PCR validation of Sema4F-GOF (S4F-GOF) overexpression and shRNAi knockdown in human glioma cell lines. Data are derived from n=3 biological replicates per condition. Results are plotted as mean +/− SD. Values were analyzed by Brown-Forsythe and Welch two-way ANOVA. S4F-GOF showed significant upregulation compared to uninfected control (**P=0.0082). shS4F #4 showed significant downregulation compared to shScramble cells (*P=0.0167).

