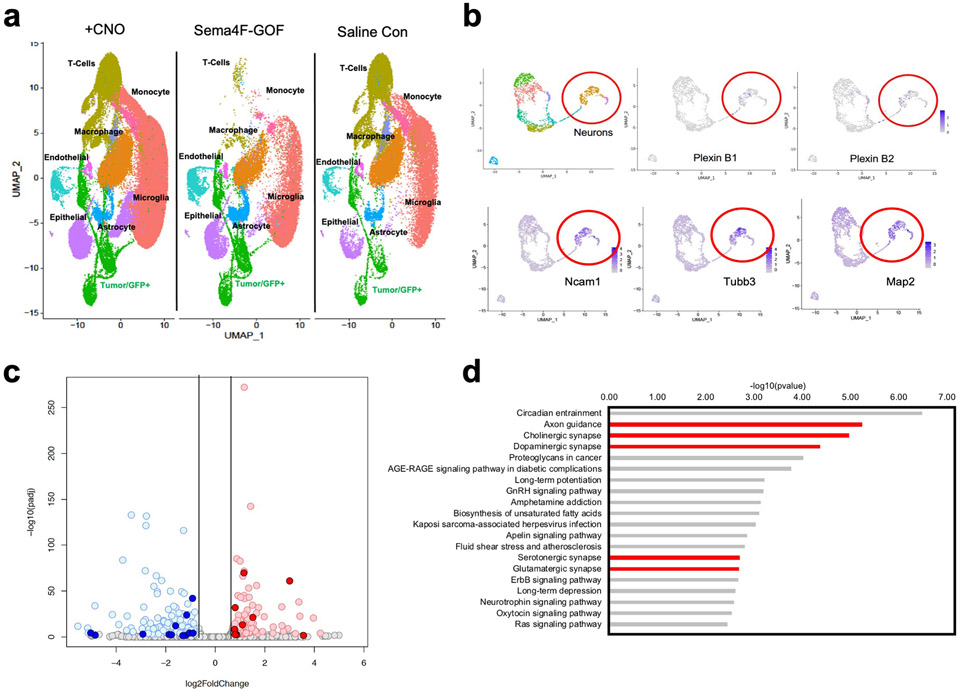
Extended Data Figure 9. Single Cell RNA-Seq analysis.
a. Single Cell RNA-Seq DimPlots of P50 IUE-HGG from CNO, Sema4F, and saline controls UMAP plot of full single cell datasets from CNO and Saline treated and Sema4F GOF tumors. Tumors were isolated and sequenced as outlined above. All clusters were represented in all datasets, though their relative abundance varied. b. Single cell RNASeq analysis of from IUE-glioma model, sub-clustering on non-tumor, GFP-negative cells. Red circle denotes neuronal populations, marked by Map2, Tubb3, and Ncam. Note that Plexin B1 and B2 expression is enriched in neuronal populations, denoted by purple dots. c. Volcano plot depicting the differentially expressed genes (DEGs) between human glioma cell lines overexpressing Sema4F (Sema4F-GOF) and controls. For downregulated genes with blue color: padj<0.001 & log2FoldChange<(-0.75); for upregulated genes in red: padj<0.001 & log2FoldChange>0.75) d. GO analysis of DEGs upregulated in the Sema4F-GOF glioma cell lines. DEGs from padj<0.001 & log2FoldChange>0.75)

