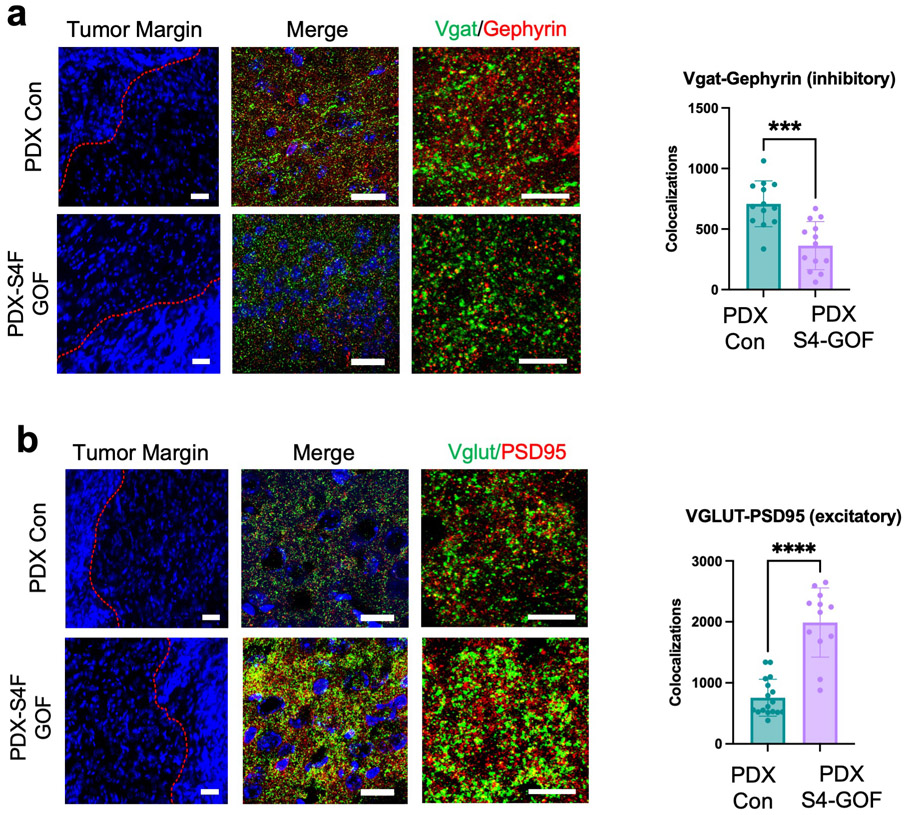
Extended Data Figure 10. Staining for synaptic markers in mice bearing PDXSema4F-GOF tumors.
a. Antibody staining of inhibitory synapses (VGAT-Gephryin) and b. excitatory (Vglut2PSD95) synapse from P50 mouse brains at peritumoral margins from PDX tumors ovexpressing Sema4F and control. Box denotes zoomed in region in adjacent panel (20X, 63X, and 200X magnification left to right; scale bar left to right: 50 um, 20 um and 10 um). Quantification of synaptic staining via unpaired two-tailed t-test is derived from PDX-Con n=3 and PDX-S4F-GOF n=3, utilizing a total of 13 fields of view from these sections for each experimental condition, (***P=0.0001, ****P<0.0001), data are presented as mean values +/− SE.

