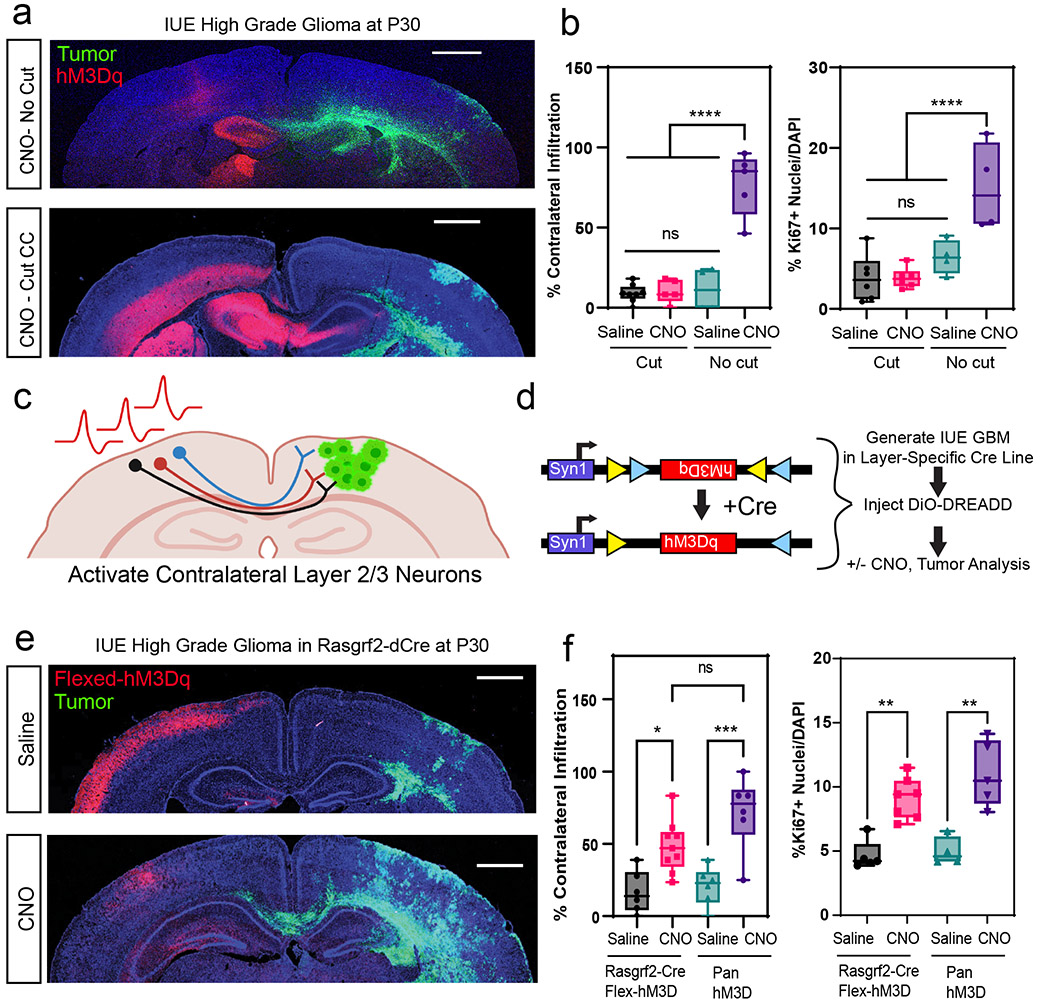
Figure 2. Callosal projection neurons promote glioma progression.
a. Representative images from IUE-HGG tumors at P30 demonstrating infiltration with a severed corpus callosum (cut-CC) or control (no cut); green is tumor; red is AAV-DREADD virus. b. Quantification of infiltration and Ki67 expression at P30 via two-way ANOVA. Analysis is derived from AAV+CNO (No Cut) n = 5, AAV+Saline (No Cut), n = 4, AAV+CNO (Cut) n = 6, CC-cut+AAV+Saline (Cut) n = 6 (****P<0.0001). c-d. Schematic of callosal projection neuron activation experiment and Rasgrf2-dCre mouse line with Cre-inducible DIO-hM3D-2a-mCherry DREADD to selectively activate layer2/3 neurons in contralateral hemisphere. e. Representative images from IUE-HGG tumors, injected with AAV-DIO-hM3D-2a-mCherry in Rasgrf2-Cre mice; green is tumor, red is AAV-DIO-DREADD virus. f. Quantification of infiltration and Ki67 expression at P30 via one-way ANOVA. Analysis is derived from Rasgrf2+AAV+CNO n=9, Rasgrf2+AAV+Saline n=6, 3xCr+AAV+CNO n=6, 3xCr+AAV+Saline n=6. (*P=0.0225, ***P=0.0015, **P=0.011). Data are plotted as median (center line), IQR (box limits) and minimum and maximum values (whiskers) (b,f). Scale bars are 1000um.

