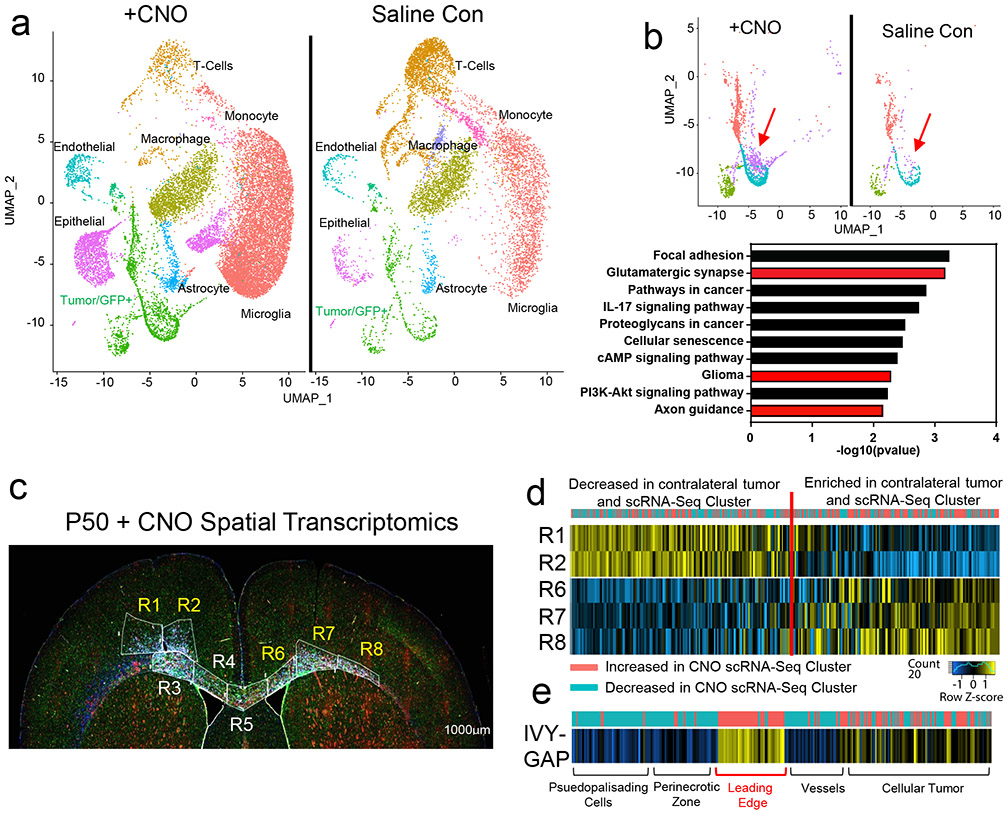
Figure 3. Identification of activity-dependent infiltrating glioma population.
a. Single Cell RNA-Seq DimPlots of P50 IUE-HGG from CNO and saline controls. b. Sub-clustering analysis of GFP+ tumor cells shown in a; red arrow indicates the cluster of interest. GO-term analysis on upregulated (average log FC>0, P<0.05) genes was performed using EnrichR and the KEGG 2021 Human dataset. c. Spatial transcriptomics on P50 IUE-HGG from the CNO group; R1-R2 denote ipsilateral tumor, R3-R5 denote tumor within corpus callosum, R6-R8 denote infiltrating tumor in contralateral hemisphere. d. Heatmap depicting the expression of markers associated with the single cell cluster of interest from b and their relative expression across the tumor regions displayed in c. Fold change of markers from the scRNA-Seq data are mapped in pink and blue. e. Heatmap depicting the enrichment of markers associated with the single cell cluster of interest and their relative expression across various anatomical locations in human GBM, derived from the IVY-GAP database. These enrichment scores were generated with AUCell analysis (depicted in red and blue), or ssGSEA analysis (depicted in yellow and blue) and plotted as a heatmap

