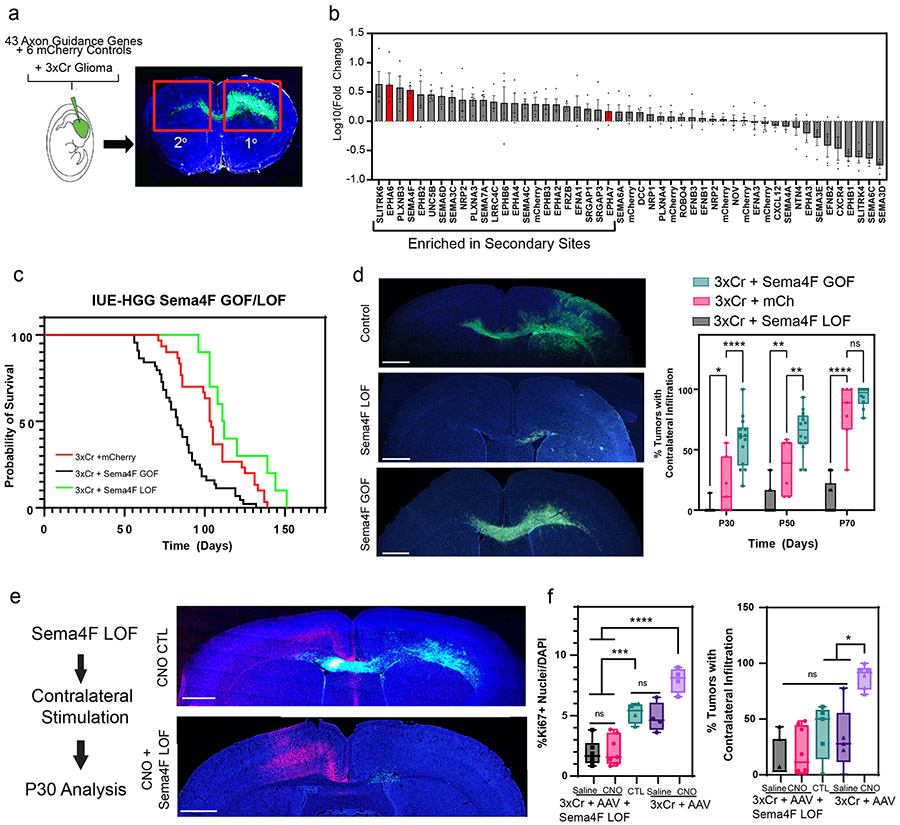
Figure 4. In vivo screen identifies Sema4F as a driver of glioma progression.
a. Schematic of barcoded screen, tumors were harvested from ipsilateral primary and contralateral secondary tumor sites. b. Next-generation sequencing for barcode amplification. Samples were derived from n=4 biological replicates with paired primary tumor, secondary tumor, and input library samples to derive fold change relative to starting abundance. Results are plotted as mean +/− SEM. c. Kaplan-Meier survival curve of individual gain-of-function and loss-of-function for Sema4F. Sema4F-GOF (medianS4FGOF=83 days, Chisq = 14.8, df = 1 p-value = 0.0001, n = 44), Sema-LOF (medianS4FLOF=112 days, Chisq = 3.9, df = 1 p-value = 0.05, n = 10), controls (n=18) d. Representative images from IUE-HGG tumors at P50 from Sema4F-GOF, Sema4F-LOF, or control groups demonstrating infiltration; green is tumor. e. Quantification of infiltration from these tumors across the P30-P70 time course via two-way ANOVA. Analysis is derived from Sema4F-GOF p30 n=14, Sema4F-GOF p50 n=14, Sema4F-GOF p70 n=10, Sema4F CTL p30 n=7, Sema4F CTL p50 n=6 Sema4F CTL p70 n=7, Sema4F-LOF p30 n=17, Sema4F-LOF p50 n=16, Sema4F-LOF p70 n=19. (*P=0.0462, **P=0.001, ****P<0.0001). f. Representative images from IUE-HGG tumors at P30 after combined Sema4F-LOF and neuronal activation (CNO); green is tumor, red is AAV-DREADD virus.
g. Quantification of tumor infiltration and Ki67 expression at P30 analyzed via two-way ANOVA. Analysis is derived from Sema4F-KO+AAV+Saline n=7, Sema4F-KO+AAV+CNO n=8, 3xCr CTL n=5, 3xCr+AAV+Saline n=5, 3xCr+AAV+CNO n=6. (*P=0.0195, ***P=0.0003, ****P=<0.0001). Scale bars are 1000um.

