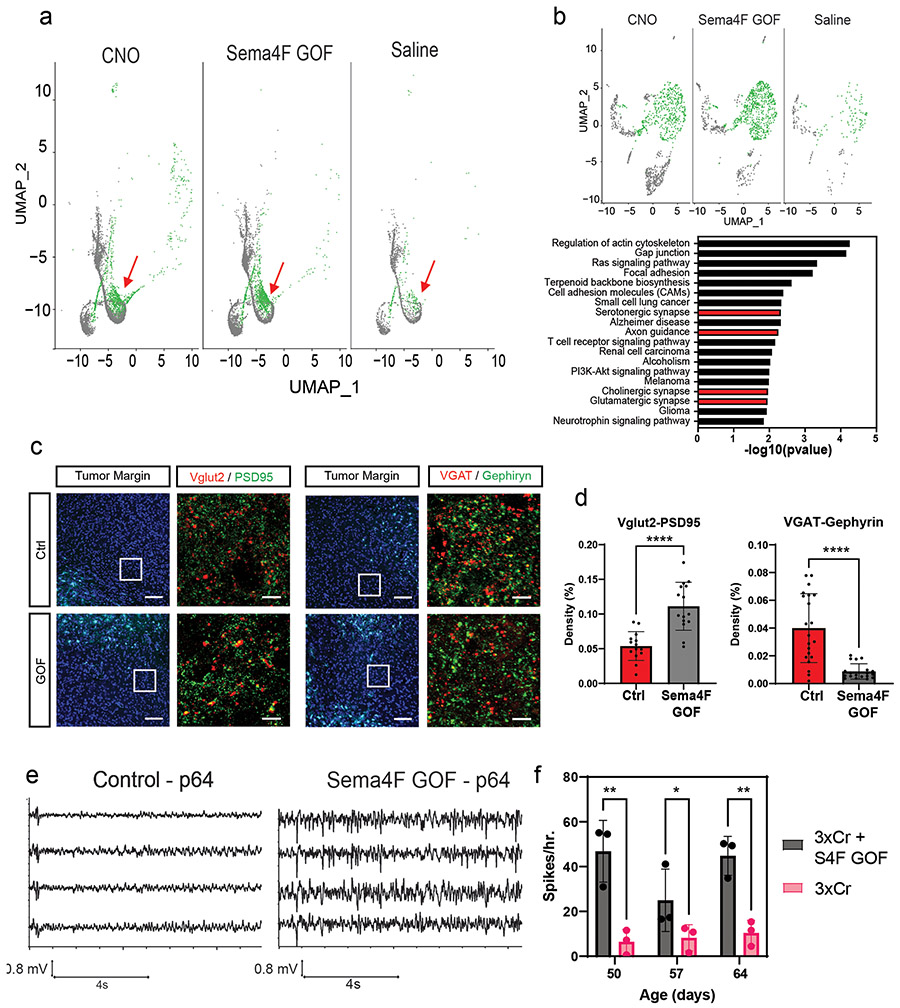
Figure 5. Sema4F promotes synaptic remodeling and brain hyperactivity.
a. Single Cell RNA-Seq DimPlots of P50 IUE-HGG from Sema4F-GOF, CNO, and saline controls; shown is the GFP+ tumor cluster. Infiltrating tumor subpopulation is highlighted in green and denoted by red arrow. b. Sub-clustering analysis of tumor cells. Analysis of altered expression in this unique prospective cell population (in green) was performed using EnrichR and the KEGG 2021 Human dataset. c. Antibody staining of excitatory (Vglut2-PSD95) and inhibitory synapses (VGAT-Gephryin) P50 mouse brains at peritumoral margins from Sema4F-GOF and control tumors; box denotes zoomed in region in adjacent panel (10X and 200X magnification left to right; white scale bar is 12.5μm and yellow scale bar is 200μm). d. Quantification of synaptic staining. Images were sampled from n=3 biological replicates, with n=13 CTL, n=15 S4F GOF, n=16 S4F LOF fields sampled for Vglut/PSD95 colocalization, and n=23 CTL, n=19 S4F GOF, n=16 S4F LOF fields sampled for Vgat/Gephryn colocalization. Results presented as mean +/− SD and ****P<0.0001). e. Sample EEG traces from mice bearing control or Sema4F-GOF tumors. f. Quantification of spikes/hr over a 24-hr period at one-week intervals from P50 to P64. Spikes were recorded in 3 mice per condition and analyzed via two-way ANOVA (*P=0.024) and plotted as mean values +/− SD . Data are plotted as median (center line), IQR (box limits) and minimum and maximum values (whiskers) (c,f).

