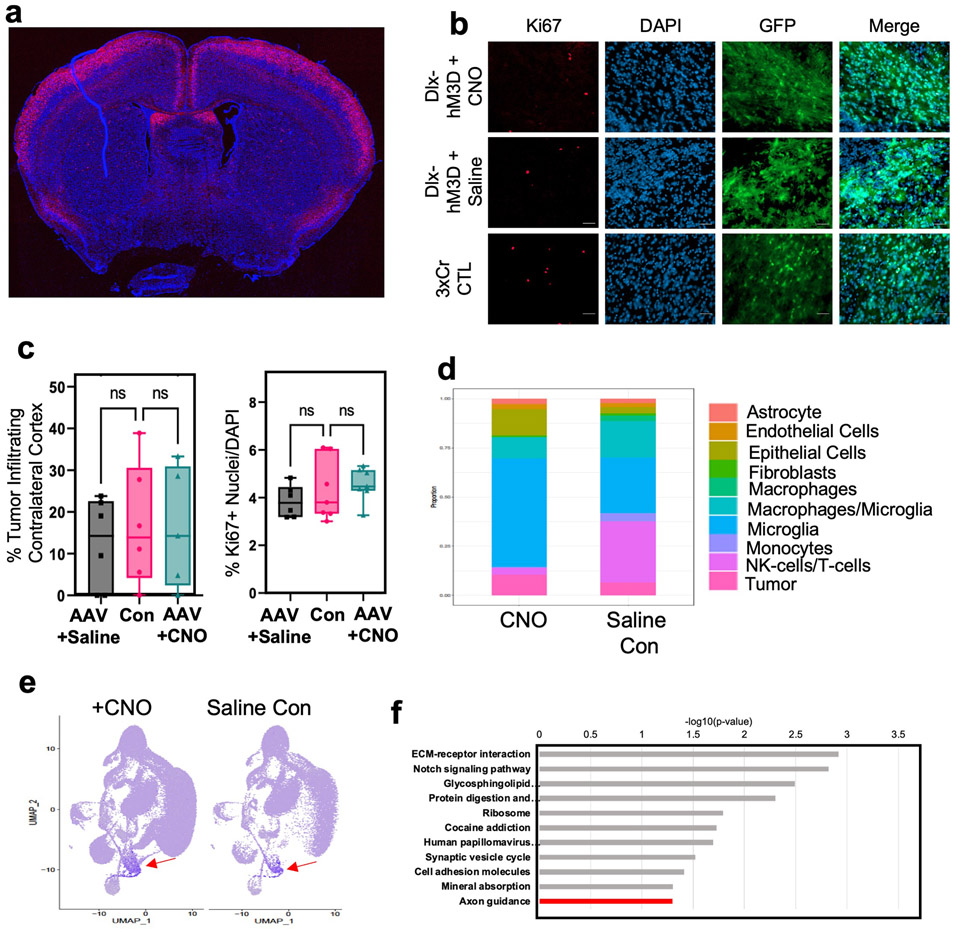
Extended Data Figure 4. Activation of contralateral inhibitory neurons does not promote tumor progression.
a. Representative image of Rosa-LSL-TdTom + Rasgrf2-dCre mouse brain harvested 2 days post Trimethoprim treatment. Cells from layer 2/3 of the cortex show TdTom labelling. b. Representative images from IUE-HGG tumors at P30 demonstrating infiltration and Ki67 expression after activation of inhibitory neurons with AAV-Dlx5/6-hM3Dq in the cortex contralateral. c. Quantification of tumor infiltration and Ki67 expression at P30. Infiltration analyzed one-way ANOVA. Data derived from 3xCr CTL (n=7), 3xCr + DLX-hM3Dq-mCh + Saline (n=6), 3xCr + DLX-hM3Dq-mCh + CNO (n=7) tumors with 18 coronal slices analyzed per tumor. Coronal sections with infiltrating tumor showed no difference in proliferation compared to saline treated (p-value = 0.1823) or control tumors (p-value = 0.5328) or infiltration at P30 compared to Saline (p-value = 0.8880) or control tumors (p-value = 0.9981). d. Stacked bar chart of SingleR labeled populations percent representation in CNO and Saline single cell sequencing datasets. e. Feature plot of cluster of interest marker genes. Color represents a score assigned based on overall expression of marker genes. Seurat’s AddModuleScore function was used to calculate these scores. Red Arrow denotes population of interest featured in Fig. 3B. f. GO terms of genes enriched in the spatial transcriptomics analysis of the leading edge of P50 mouse tumors (R6-R8), (Cutoff for DEG via DESeq2, with p-value < 0.05). Data are plotted as median (center line), IQR (box limits) and minimum and maximum values (whiskers) (c).

