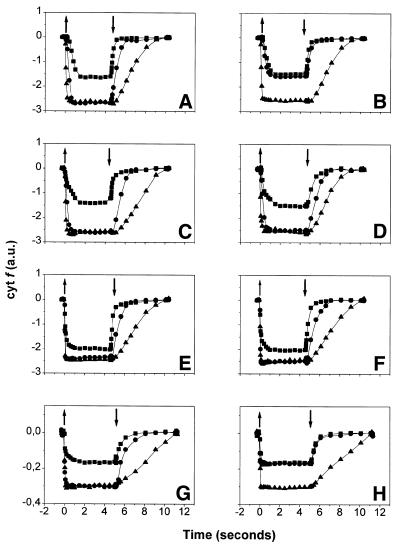
Fig. 1. Cytochrome f redox changes in continuous light as measured by absorbance changes. (A, C, E and G) State 1. (B, D, F and H) State 2. (A and B) wild type; (C and D) stt7; (E and F) bf4; (G and H) A-AUU strain. Symbols: squares, no inhibitors; circles, DCMU 10 µM; triangles, DBMIB 2 µM. Other conditions are described in Methods. Upward and downward arrows indicate the switch on and off of the actinic light, respectively. A decrease of absorbance corresponds to oxidation of cytochrome f. Traces were normalized on the amplitude of a PSI-driven charge separation signal measured at 515 nm.

An official website of the United States government
Here's how you know
Official websites use .gov
A
.gov website belongs to an official
government organization in the United States.
Secure .gov websites use HTTPS
A lock (
) or https:// means you've safely
connected to the .gov website. Share sensitive
information only on official, secure websites.
