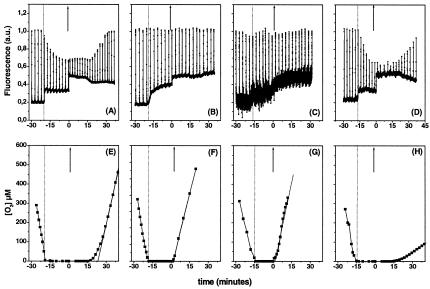
Fig. 2. Fluorescence emission (A–D), oxygen consumption and evolution (E–H) in C. reinhardtii wild-type (A and E), stt7 (B and F), bf4 (C and G) and A-AUU (D and H) cells during state transition. Cells were incubated in the dark. At 3 min intervals, a saturating light pulse was given to measure Fm. Fo corresponds to the lower trace in (A)–(D). The upward arrow indicates the switch on of the actinic light at time 0. Note that fluorescence emission was multiplied by a factor of 4 in (C).

An official website of the United States government
Here's how you know
Official websites use .gov
A
.gov website belongs to an official
government organization in the United States.
Secure .gov websites use HTTPS
A lock (
) or https:// means you've safely
connected to the .gov website. Share sensitive
information only on official, secure websites.
