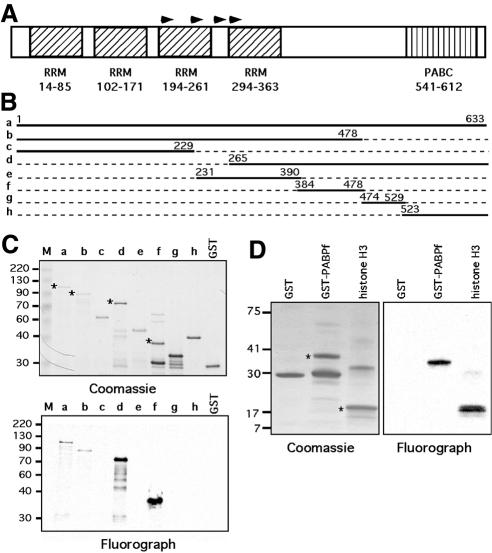
Fig. 2. Deletion analysis of PABP1 identifies the methylated region. (A) Diagram of the domain structure of PABP1. Arrowheads represent the start sites of the clones identified in the primary screen. (B) The regions of PABP1 that were fused to GST for deletion analysis. (C) Purified GST fusion proteins were incubated with recombinant CARM1 in the presence of [3H]AdoMet, separated by SDS–PAGE, and the methylated proteins visualized by fluorography (lower panel). A duplicate substrate gel was Coomassie stained to demonstrate loading (upper panel). (D) Histone H3 and GST–PABPf are both efficiently methylated by CARM1. The asterisks on the Coomassie gels indicate the protein bands that are methylated on the fluorograph.

An official website of the United States government
Here's how you know
Official websites use .gov
A
.gov website belongs to an official
government organization in the United States.
Secure .gov websites use HTTPS
A lock (
) or https:// means you've safely
connected to the .gov website. Share sensitive
information only on official, secure websites.
