Fig. 2.
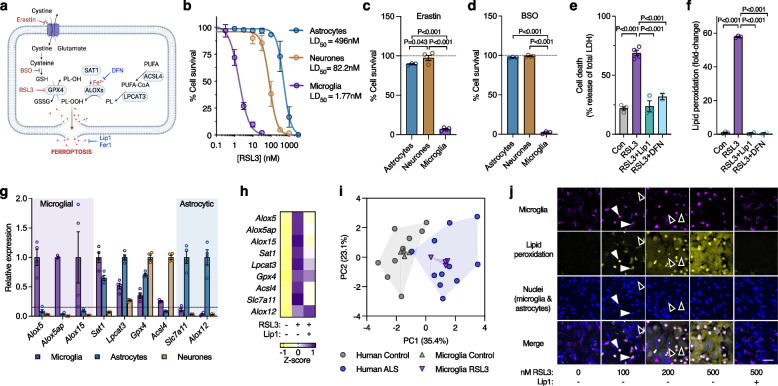
Microglia have heightened sensitivity to ferroptosis. a Ferroptosis is canonically induced by erastin and RSL3, which inhibit the glutamate-cystine antiporter and GPX4, respectively. Ferroptosis is canonically inhibited by lipid radical scavengers liproxstatin-1 (Lip1) and ferrostatin-1 (Fer1). Ferroptosis is also exacerbated by inhibition of glutathione (GSH) synthesis by buthionine sulphoximine (BSO) or by iron (Fe2+), and can be non-specifically inhibited by iron chelators such as deferiprone (DFN). b-d Survival (MTT reduction) of cultured microglia, astrocytes and neurones exposed to the ferroptosis inducers RSL3, erastin or BSO (n = 3–12 for b). e, f Cytotoxicity (LDH release) and lipid peroxidation in cultured microglia exposed to RSL3 (2 µM) and protection by the inhibitors liproxstatin-1 (Lip1) and deferiprone (DFN). Lipid peroxidation in f measured using oxidised:reduced of the ratiometric fluorophore C11-BODIPY. g Transcripts associated with ferroptosis in isolated primary murine cultures of microglia, astrocytes and neurones, depicted relative to highest expression. h Effect of RSL3 (25 nM; 8 h) on transcripts associated with ferroptosis in cultured microglia, and protection by Lip1 (n = 2–4). i Principal component analysis of ferroptosis genes in response to RSL3 treatment in cultured microglia or ALS in human spinal cord. j Lipid peroxidation in response to RSL3 and protection with Lip1 in mixed glial cultures (microglia and astrocytes) detected using oxidised:reduced C11-BODIPY (yellow) showing lipid peroxidation is restricted to microglia (magenta, detected with Dylight 649-labelled isolectin, indicated with white arrowheads) relative to the preponderant astrocytes (black arrowheads). Images derived from Supplementary Video 1. Scale bar (j) = 50 µm. P values in c-f indicate significant differences. Error margins in b-g are S.E.M. Data points in c-g represent independent cultures. Individual heatmap values in h represent mean. Symbols in i represent individual control or ALS cases, or independent microglial cultures. Proportion of variance explained by each principal component in i is denoted on axes. Data in i derived from fold expression change shown in Supplementary Figs. 3b and 5b

