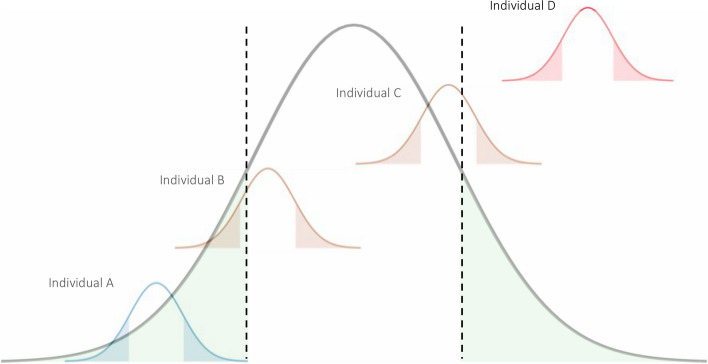
Fig. 2.
Risk stratification based on PRS confidence/credible interval (CI). The large distribution illustrates the PRS distribution at the population level, and the four small ones refer to individual PRS distributions for participants with different PRS-based risks of lung cancer. The dashed horizontal lines indicate the population level thresholds for risk stratification. Individuals with their PRS CI above a pre-specified population-level threshold t at the upper tail (e.g., t = 90th percentile) were classified as certainly high genetic risk, and similarly for individuals with PRS CI below the population level threshold t at the lower tail (e.g., t = 10th percentile) as certainly low genetic risk. Individuals whose CI covered the population level threshold were considered uncertain

