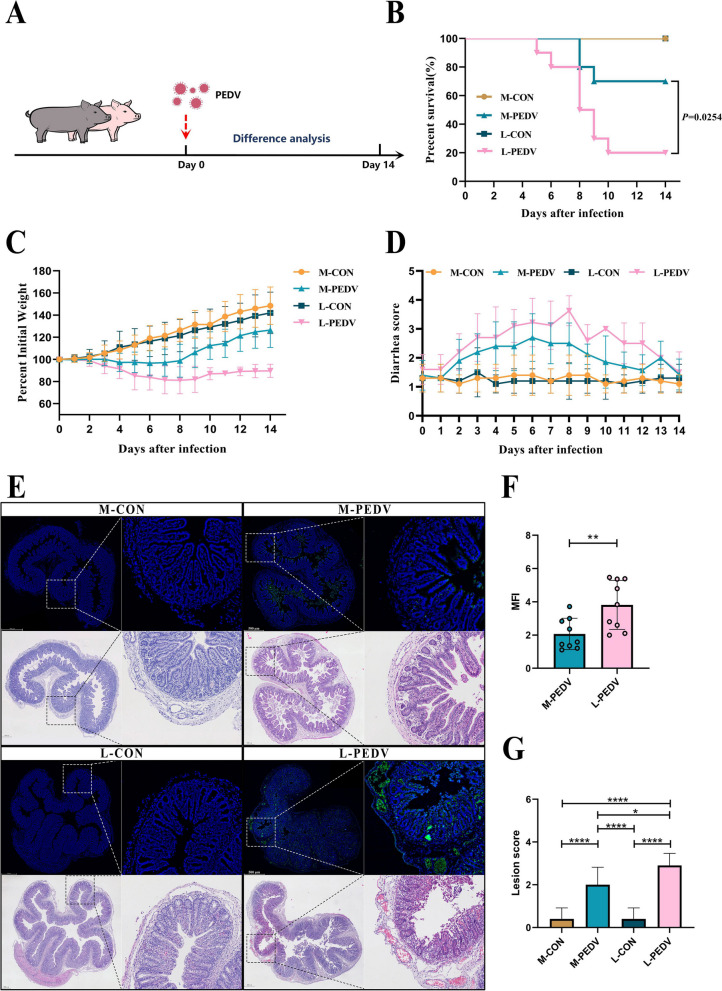
Fig. 1.
Differences in PEDV infection between Min pigs and Landrace pigs. A PEDV infection model in Min pigs and Landrace pigs (n=10/group) (M-CON, Min pigs challenged with PBS; M-PEDV, Min pigs challenged with PEDV; L-CON, Landrace pigs challenged with PBS; L-PEDV, Landrace pigs challenged with PEDV). Comparative analysis of survival (B), weight loss (C), and diarrhea (D) in each group of piglets. E Comparison of histopathological changes (H&E staining) and PEDV viral load in the jejunum of piglets on day 8 post-infection. The left image is scanned at a magnification of 40×, and the right image is scanned at a magnification of 200×. F Analysis of average fluorescence intensity. G Histopathological scoring of tissues. The results are presented as the means ± SD, and statistical significance was calculated by t tests for two groups and one-way ANOVA for four groups. *P < 0.05; **P < 0.01; ****P < 0.0001

