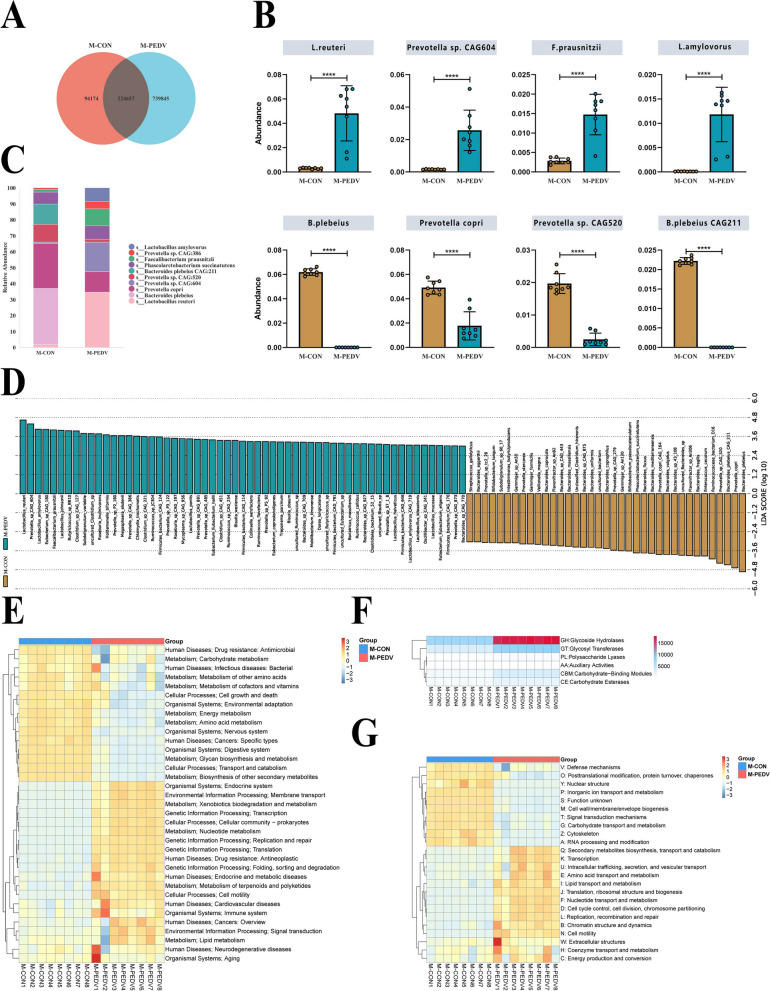
Fig. 4.
Metagenomic analysis of gut microbiota in M-CON and M-PEDV piglets. A Gene number distribution of M-CON pig and M-PEDV pig gut microbes (n=8/group). B Analysis of significantly upregulated (top 4) and downregulated (top 4) species in the abundance table. C Species comparison analysis (top 10). D LEfSe analysis (LDA score > 4). Functional annotation and abundance information of the samples in the KEGG (E) and eggNOG (G) databases and clustering at the level of functional differences. F Functional annotation and statistics of samples in the CAZy database. The results are presented as the means ± SD, and statistical significance was calculated by one-way ANOVA. ****P < 0.0001

