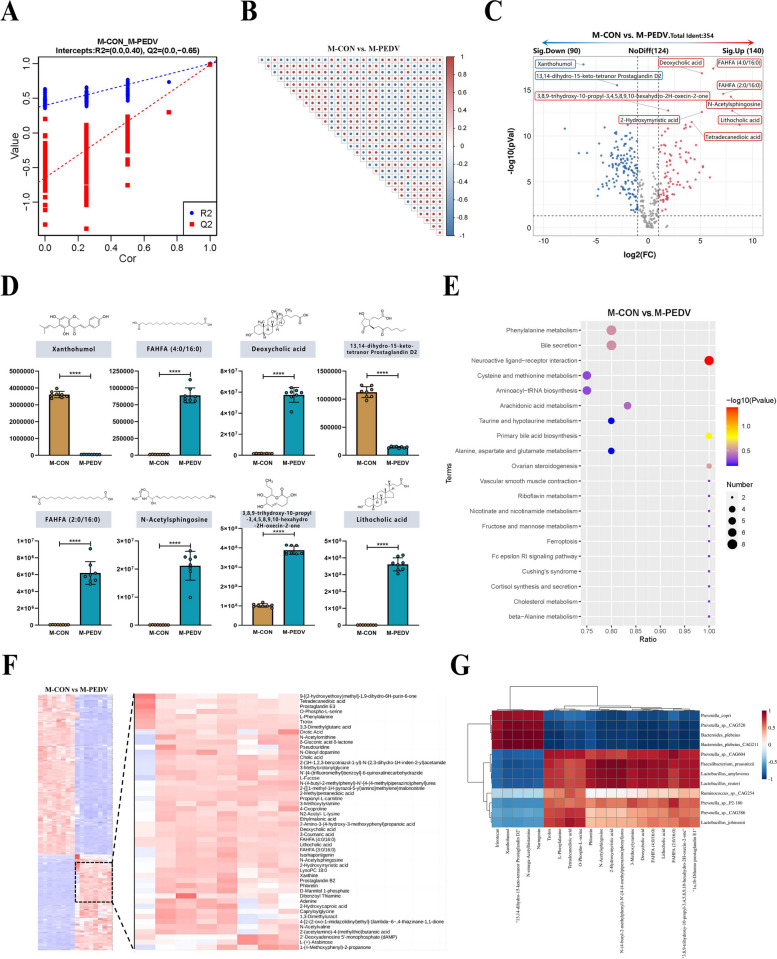
Fig. 6.
Untargeted metabolomic analysis of M-CON and M-PEDV piglet gut contents. A Partial least squares discrimination analysis (PLS-DA) (n=8/group). B Correlation of differentially abundant metabolites (top 30) with a significance of P<0.05. C Volcano plot analysis of differentially abundant metabolites with a threshold of VIP > 1.0, FC > 1.5, or FC < 0.667, and P-value < 0.05. D Metastats analysis counted the significantly up and downregulated differential metabolites (top 8). E Functional comparative analysis of metabolic components in the KEGG database (top 20). F Hierarchical clustering analysis of metabolic expression patterns. G Correlation analysis between macrogenomics and metabolomics based on Pearson correlation coefficient. The results are presented as the means ± SD, and statistical significance was calculated by one-way ANOVA. ****P < 0.0001

