Fig. 8.
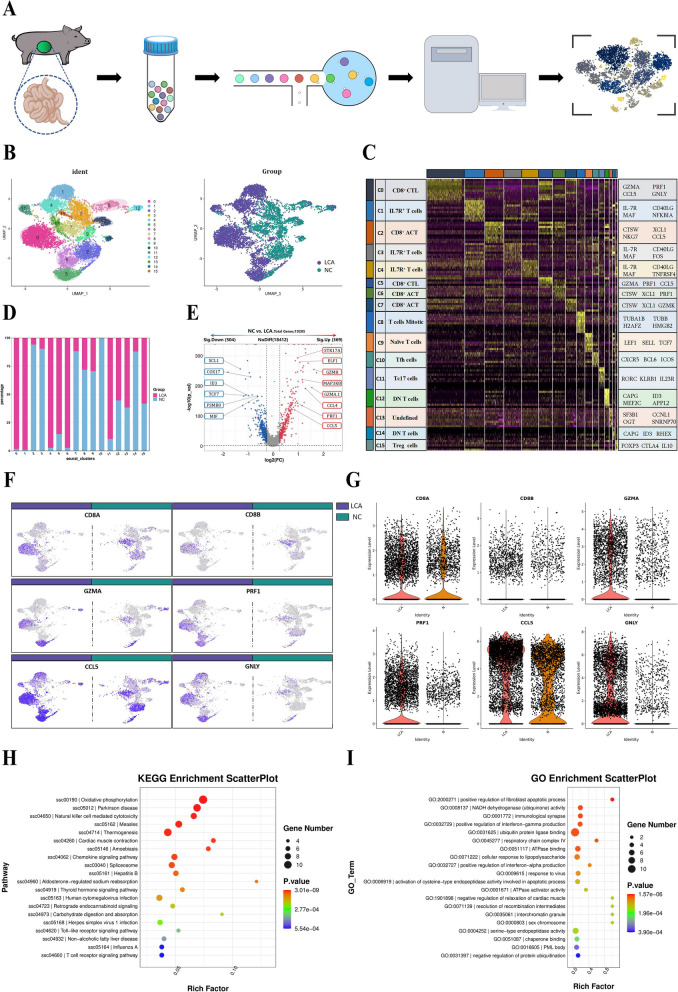
Single-cell RNA sequencing analysis of piglet intestines. A Workflow for single-cell and RNA-seq of isolated T cells from pigs. B Dimensionality reduction analysis based on the UMAP algorithm, with the number of clusters corresponding to those listed in C. C Heatmap clustering data from single-cell analysis of LCA-treated or untreated groups, where the cell clusters are indicated by the upper color block. The signature genes that were differentially expressed in each cluster are shown on the far right, and the names of the subgroups of cell clusters are shown on the far left. D Percentage of cells in the LCA-treated or untreated group in the cluster. E Volcano plot for differential genetic screening of cells in the LCA-treated or untreated groups. Analysis of the expression of the marker genes CD8A, CD8B, GZMA, PRF1, CCL5, and GNLY in cells from LCA-treated or untreated groups by UMAP (F) and cytogenetic enrichment (G) methods. Differential gene function analysis of the CD8+ CTL cluster in the KEGG (H) and GO (I) databases

