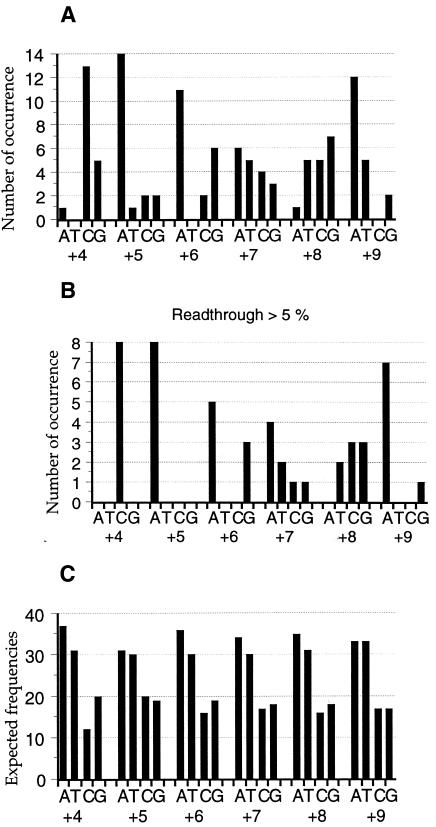
Fig. 2. Number of occurrences of each nucleotide in the 3′ sequence. (A) Results of the initial screening. The y-axis represents the number of occurrences at positions +4, +5, +6, +7, +8 and +9. (B) Only sequences giving readthrough values >5% were taken into account. (C) Expected frequencies of nucleotides at +4 to +9 positions from natural stop codons in the yeast genome. Results were obtained from the Transterm database (Jacobs et al., 2000).

An official website of the United States government
Here's how you know
Official websites use .gov
A
.gov website belongs to an official
government organization in the United States.
Secure .gov websites use HTTPS
A lock (
) or https:// means you've safely
connected to the .gov website. Share sensitive
information only on official, secure websites.
