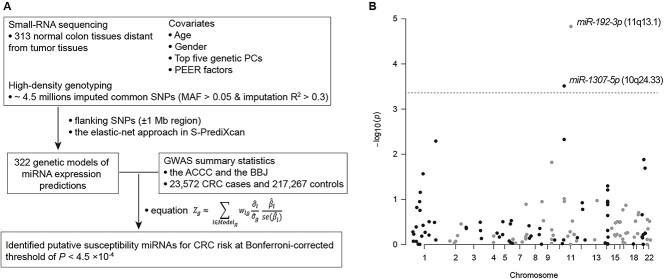
Figure 1.
Study design of miRNA-TWAS and association results of the TWAS. (A) a workflow to illustrate our data generation and resources and the analytic workflow. (B) Associations between evaluated expression levels of miRNAs and CRC risk. The dashed line refers to Bonferroni-corrected P < 0.05. The two miRNAs, miR-1307-5p, and miR-192-3p were presented with statistically significant associations.

