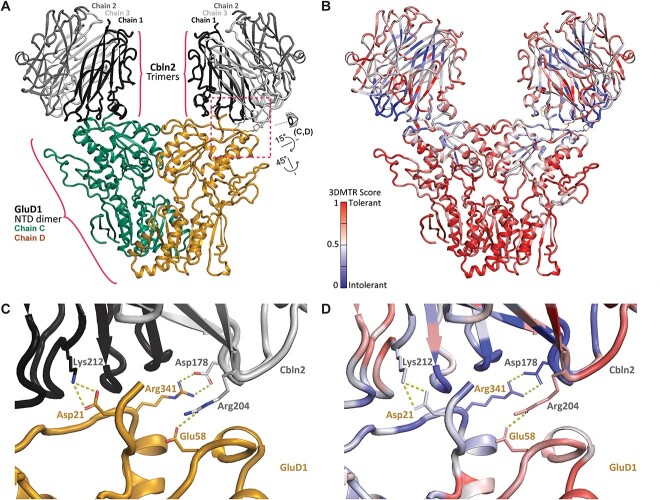
Figure 4.
GluD1-Cbln protein-protein interactions. (A) Side view of a homology model (see Supplementary Data 1) of human GRID1 in complex with human CBLN2. This structure was one frame from the MD simulation modeling the interactions between these proteins (Supplementary Fig. S2). (B) 3D MTR analysis of CBLN2 and GRID1 using the closest 21 residues in the analysis (see Supplementary Data 2). Low MTR scores (blue) indicate residues intolerant to variation, while high scores indicate residues tolerant to variation [81]. (C) Interacting residues between the GluD1-Cbln2 complex. Labeled residues are predicted to form both hydrogen bonding and salt bridge interactions between GluD1 (Asp21, Arg341, Glu58) and Cbln2 (Lys212, Asp178, Arg204). R341-D178, E58-R204, and D21-K212 salt bridges are predicted to occur during 99.5%, 99.5%, and 100% of analyzed frames. View shown is depicted in panel A by the eye cartoon. On the chain not shown here, R341 interacts with a D176. (D) 3D MTR of the site of GluD1-Cbln2 interaction (same view as in C).

