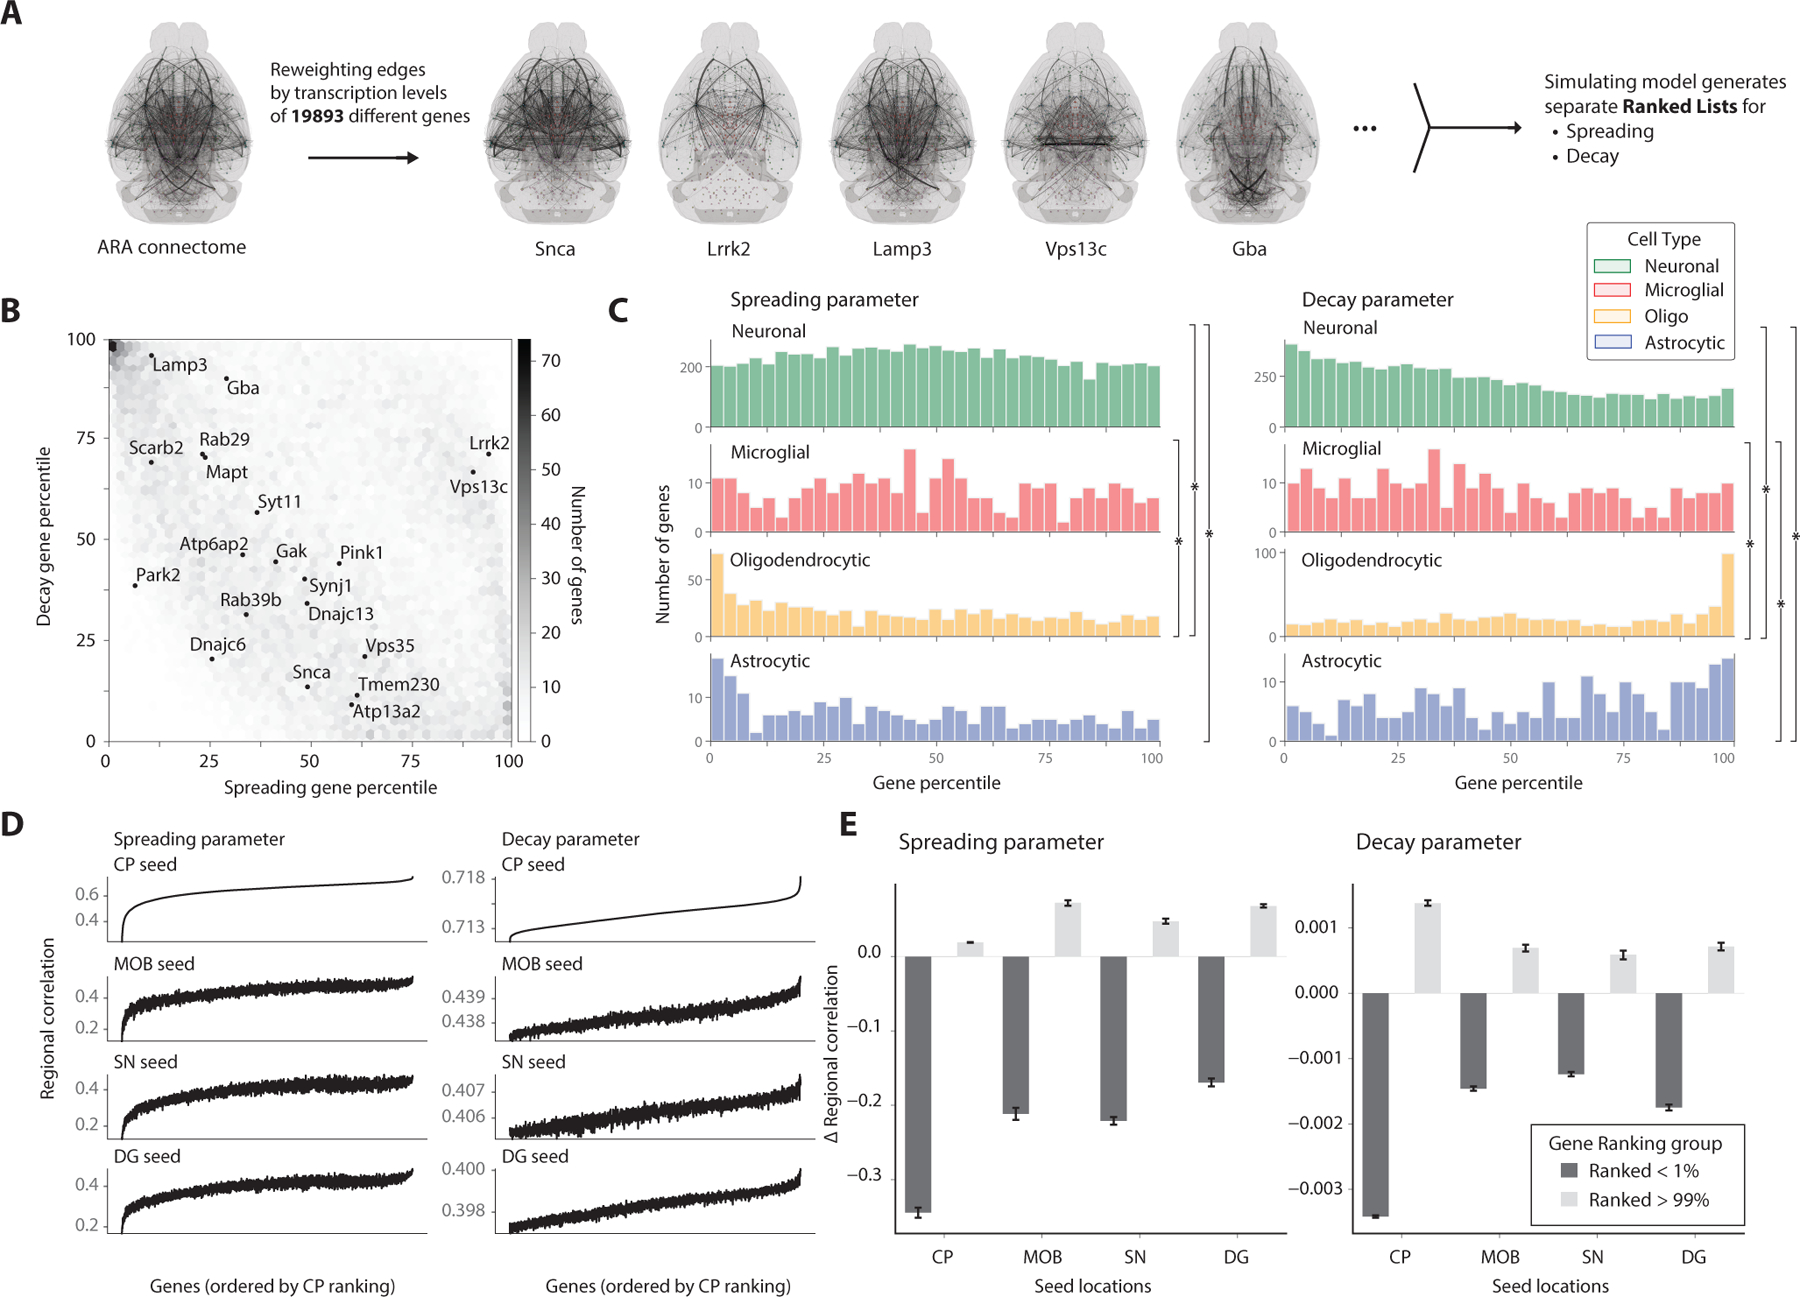
Figure 5. Integrating spatial transcriptomics data into computational model reveals genes associated with spreading across seed locations.

(A) Encoding region-specific gene densities from the Allen ISH database into the model allows for comparisons of each gene’s association with the spreading and decay parameters in improving predictive power. (B) Joint heatmap of the spreading and decay gene rankings depict clustering of genes that are relevant for either spreading or decay. Genes implicated in Parkinson’s Disease and synucleinopathies are additionally labeled. (C) Histograms of gene rankings for each parameter are grouped by cell type with highest transcription levels of that gene, taken from the Allen Atlas. Histograms were compared with the two-sample Kolmogorov-Smirnov test (*p < 0.05). (D) Simulation results from all genes in the Allen ISH database tested separately for the various PFF seed locations. The regional correlation between each gene’s simulated output and the entire timeseries for the seed location is reported, with the shared gene ordering on the x-axis determined by the striatum’s ranked genes in ascending order. (E) Encoding the highly ranked genes from the striatum dataset consistently improved the predictive power of the model for other seed regions, as measured by the correlation coefficient, while the bottom percentile genes consistently decreased the predictive power. Data are represented as mean ± SD.
