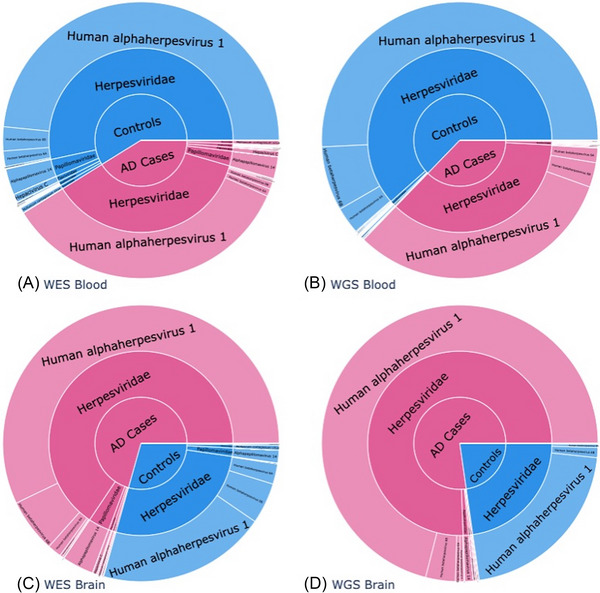
FIGURE 1.

Frequency of viral reads by tissue source and type of sequencing. Proportion of total viral reads mapping to individual species in (A) whole exome sequence (WES) data from blood, (B) whole genome (WGS) sequence data from blood, (C) WES data from brain in WES, and (D) WGS data from brain. The innermost circle shows the proportion of all viral reads between Alzheimer's disease (AD) cases and controls within each of these subsets. The middle ring shows the proportion of viral reads mapping to a viral family within AD cases and controls, and the outer ring is the breakdown between viral species within a viral family
