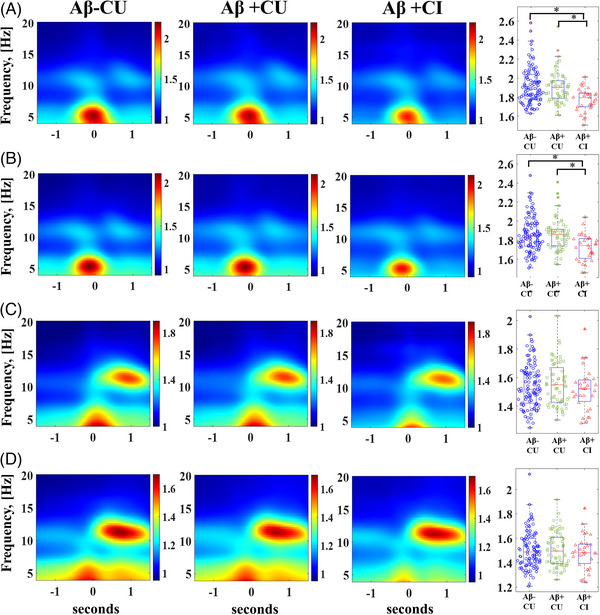
FIGURE 2.

Comparison of slow wave–theta burst (SW‐TB) and slow wave–sleep spindle (SW‐SP) coupling normalized electroencephalography (EEG) power across stratified groups spanning stages of normal aging to mild cognitive impairment in early Alzheimer's disease. (A) High transition frequency SW‐TB coupling and (B) low transition frequency SW‐TB coupling are visually represented as averaged time‐frequency plots, and quantified EEG power among individuals is graphed in box/whisker plots. (C) High transition frequency SW‐SP coupling and (D) low transition frequency SW‐SP coupling are visually represented as averaged time‐frequency plots, and quantified EEG power among individuals is graphed in box/whisker plots, Aβ = amyloid, CU = cognitively unimpaired, CI = cognitively impaired. [*] indicates statistical significance < 0.005 after adjusting for covariates and multiple comparisons (Tukey‐Kramer adjustment).
