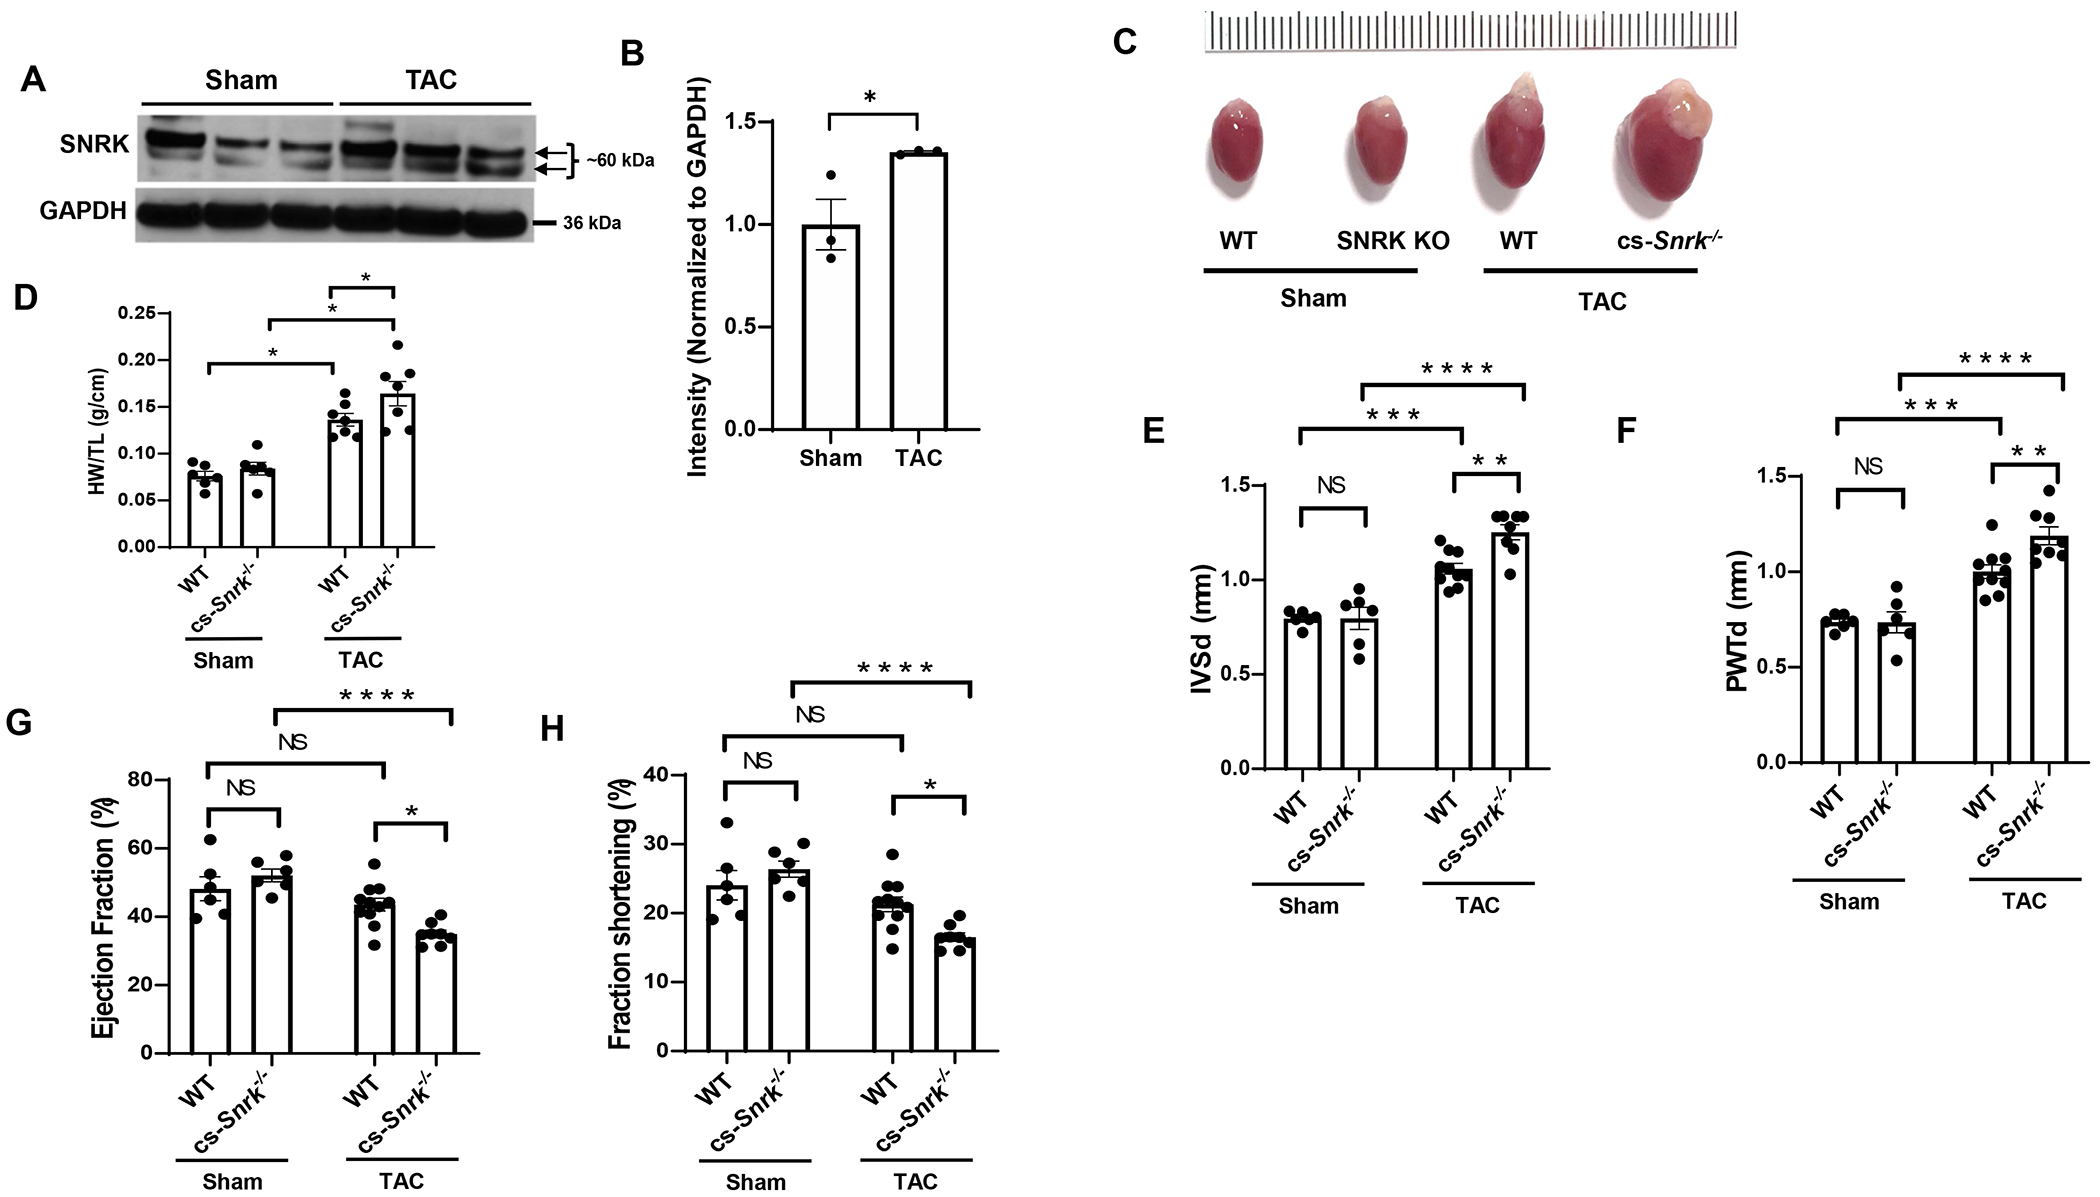
Figure 1. SNRK is increased in cardiac hypertrophy and its deletion leads to exaggerated hypertrophy.

A, SNRK protein levels in heart tissue from mice subjected to sham or 4-weeks after TAC operation. B, Summary bar graph summary of Panel A (n=3 animals per condition, unpaired t-test, *P<0.05). C, Image of freshly extracted hearts from WT and cs-Snrk−/− mice 4-weeks after sham operation or TAC. Scale bar = 0.1 cm. D, HW/TL in WT and cs-Snrk−/− mice 4-weeks after sham operation or TAC (n>6 animals per condition, two-way ANOVA with Tukey’s test, *P<0.05). E-F, IVSd (E) and PWTd (F) in WT and cs-Snrk−/− mice 4-weeks after sham operation or TAC (n=6-10, two-way ANOVA with Tukey’s multiple comparisons test). G-H, EF (G) and FS (H) in WT and cs-Snrk−/− mice 3-weeks after sham operation or TAC (n=3-11, two-way ANOVA with Sidak’s multiple comparisons test, *P<0.05, **P<0.01, ***P<0.001, ****P<0.0001.
