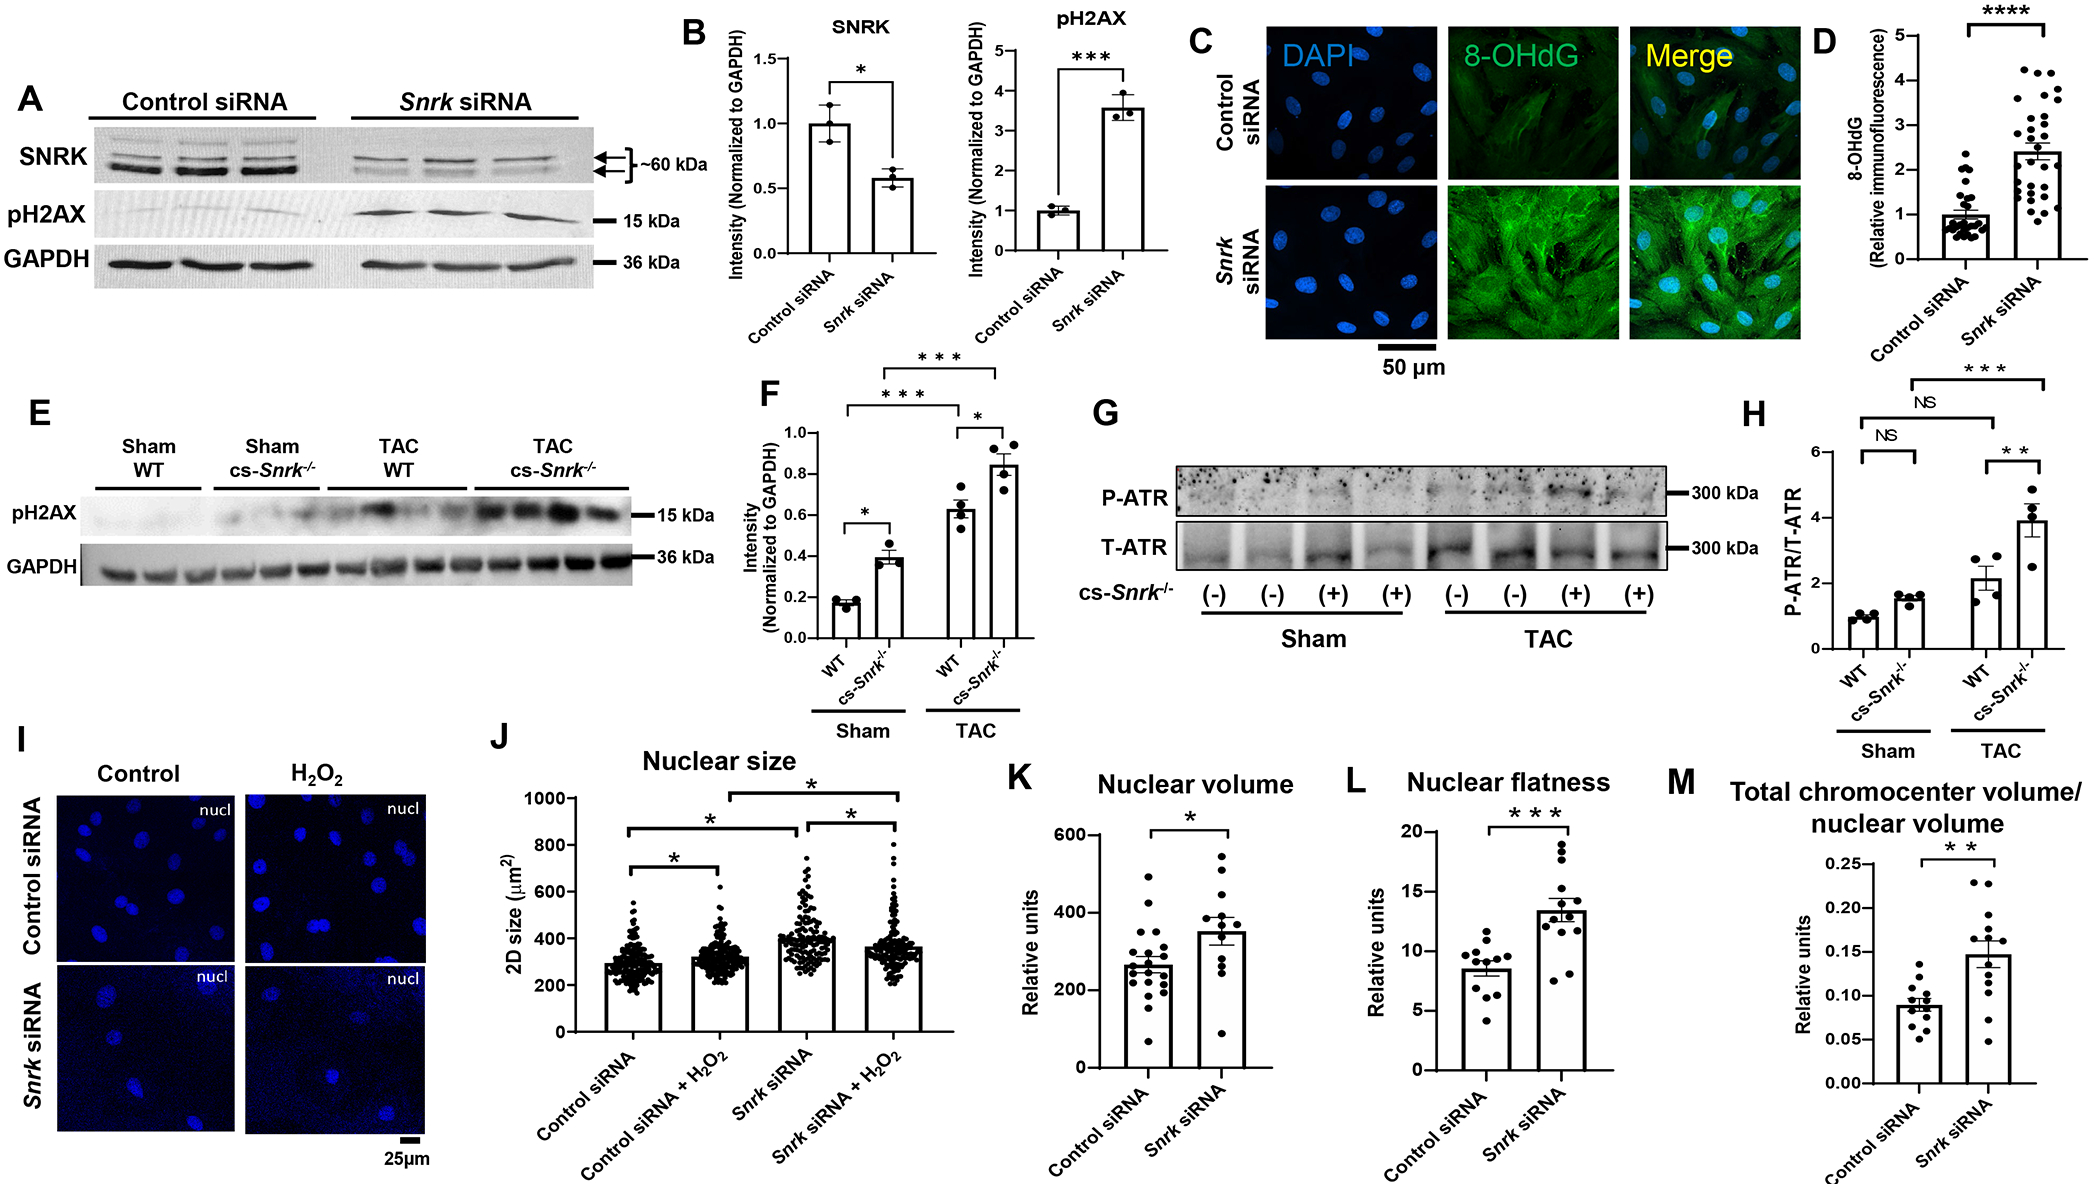
Figure 2. SNRK modulates DDR and nuclear morphology.

A, Western blot of SNRK and pH2AX in H9c2 cells treated with control or Snrk siRNA. B, Summary bar graph of Panel A (n=3, Student’s t-test). C, Representative IF images of 8-OHdG stain of H9c2 cells treated with control or Snrk siRNA. Scale bar = 50 μm. D, Results of the 8-OHdG fluorescence from Panel C (n≥30 cells measured for each condition, Student’s t-test). E, Western blot of pH2AX in the hearts of WT and cs-Snrk−/− mice treated with sham or after TAC. F, Summary bar graph of the results in Panel E (n=3-4, two-way ANOVA with Tukey’s test). G, Western blot of p-ATR and total ATR in H9c2 cells treated with control or Snrk siRNA. H, Summary bar graph of Panel G (n=4, two-way ANOVA with Tukey’s test). I, Representative IF images of DAPI stain of H9c2 cells treated with control or Snrk siRNA. Scale bar = 25 μM. J, Results of the nucleus size measurements from Panel I (n=3 independent experiments, with ≥42 cells measured for each condition per replicate, Student’s t-test). K-M, Nuclear volume (K), nuclear flatness (L), and total chromocenter volume/nuclear volume (M) measurements in H9c2 cells treated with control or Snrk siRNA. Nuclear flatness reflects the ratio of the length of the intermediate axis of the cell to length of the shortest axis. (n ≥12 cells measured for each condition, Student’s t-test). *P<0.05, **P<0.01, ***P<0.001, ****P<0.0001.
