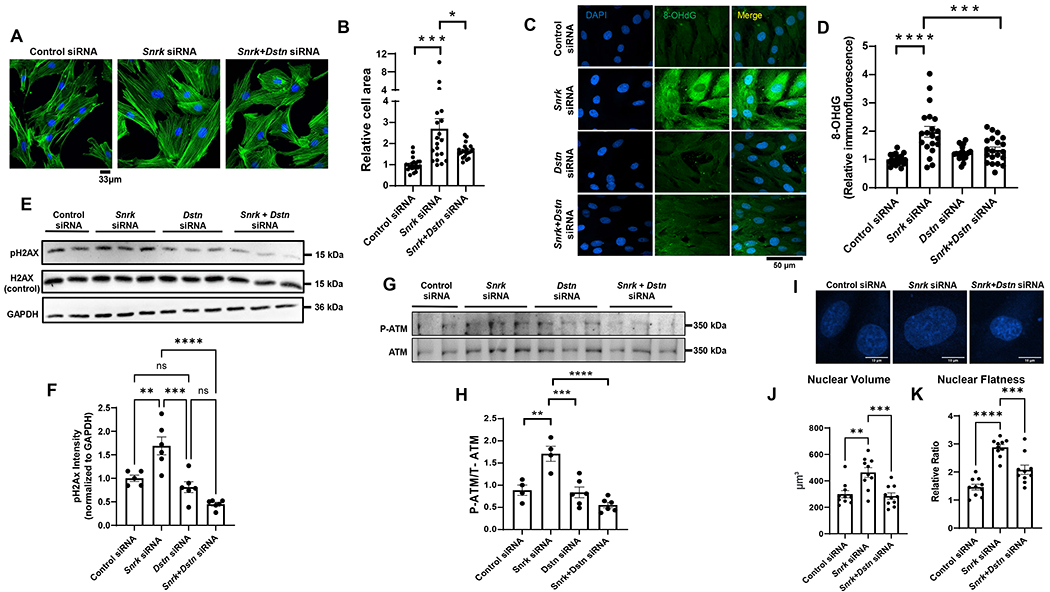
Figure 4. DSTN KD reverses the DDR and changes in nuclear morphology induced by SNRK KD.

A, Representative IF images of H9c2 cells treated with control or Snrk siRNA alone, or combination of Snrk and Dstn siRNA and stained with Phalloidin-iFluor 488 to assess cell surface area. B, Summary of results in Panel A (n=20 cells for each condition, one-way ANOVA with Tukey’s test). C, Representative IF images of 8-OHdG stain of H9c2 cells treated with control, Snrk, Dstn, or Snrk+Dstn siRNA. Scale bar = 50 μM. D, Results of the 8-OHdG fluorescence from Panel C (n=20 cells measured for each condition, two-way ANOVA with Tukey’s test). E, Western blot of SNRK, DSTN, pH2AX, and H2AX in H9c2 cells treated with control siRNA, Snrk siRNA, Dstn siRNA, or Snrk+Dstn siRNA. F, Summary of results in Panel E (n=3, one-way ANOVA with Tukey’s test). G, Western blot of p-ATM and total ATM in H9c2 cells treated with control, Snrk, Dstn, or Snrk+Dstn siRNA. H, Summary bar graph of Panel G (n=4-6, two-way ANOVA with Tukey’s test). I, Representative IF images of H9c2 cells treated with DAPI staining and with control, Snrk, or Snrk+Dstn siRNA. Scale bar = 10 μm. J-K, Nuclear volume (J) and nuclear flatness (K) in H9c2 cells treated with control, Snrk, or Snrk+Dstn siRNA. Nuclear flatness reflects the ratio of the length of the intermediate axis of the cell to length of the shortest axis. (n=10, one-way ANOVA with Tukey’s multiple comparisons test). *P<0.05, **P<0.01, ***P<0.001, ****P<0.0001.
