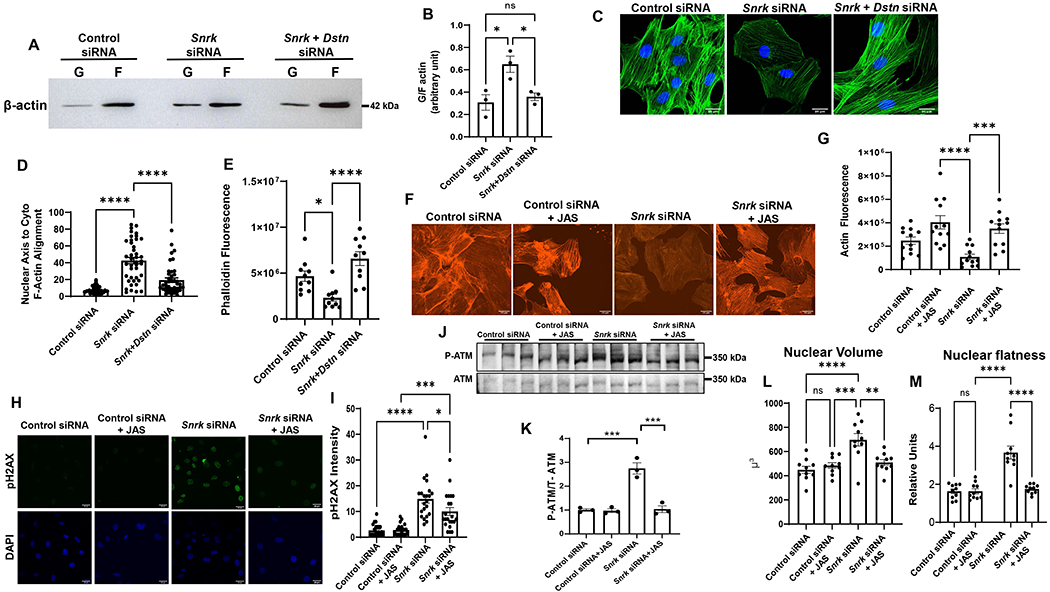
Figure 5. SNRK alters DDR and nuclear morphology through actin depolymerization.

A, Representative Western blot of F and G actin in H9c2 cells treated with control, Snrk or Snrk+Dstn siRNA. B, Summary bar graph of Western blot results in A (n=3, one-way ANOVA with Tukey’s test). C, Representative IF images probing with actin staining in H9c2 cells treated with control, Snrk or Snrk+Dstn siRNA. Scale bar = 20 μm. D, Summary bar graph of nuclear-actin angle in H9c2 cells treated with control, Snrk or Snrk+Dstn siRNA (n=42, one-way ANOVA with Tukey’s Multiple Comparisons Test). E, Phalloidin fluorescence in H9c2 cells treated with control, Snrk or Snrk+Dstn siRNA (n=10, one-way ANOVA with Tukey’s test). F, Representative fluorescence actin images of H9c2 cells treated with Snrk siRNA in the presence and absence of JAS. Scale bar = 20 μm. G, Summary bar graph of actin fluorescence of H9c2 cells with Snrk siRNA and JAS (n=12, one-way ANOVA with Tukey’s Multiple Comparisons Test). H, Representative pH2AX immunohistochemistry of H9c2 cells treated with Snrk siRNA in the presence and absence of JAS. Scale bar = 25 μm. I, Summary bar graph of pH2AX staining of H9c2 cells with Snrk siRNA and JAS (n=22, one-way ANOVA with Tukey’s Multiple Comparisons Test). J, Western blot of p-ATM and total ATM in H9c2 cells treated with control or Snrk siRNA in the presence and absence of JAS. K, Summary bar graph of Panel G (n=3, two-way ANOVA with Tukey’s test). L-M, Nuclear volume (L) and nuclear flatness (M) in H9c2 cells treated with Snrk siRNA in the presence and absence of JAS. Nuclear flatness reflects the ratio of the length of the intermediate axis of the cell to length of the shortest axis. (n=10, one-way ANOVA with Tukey’s test). *P<0.05, **P<0.01, ***P<0.001, ****P<0.0001.
