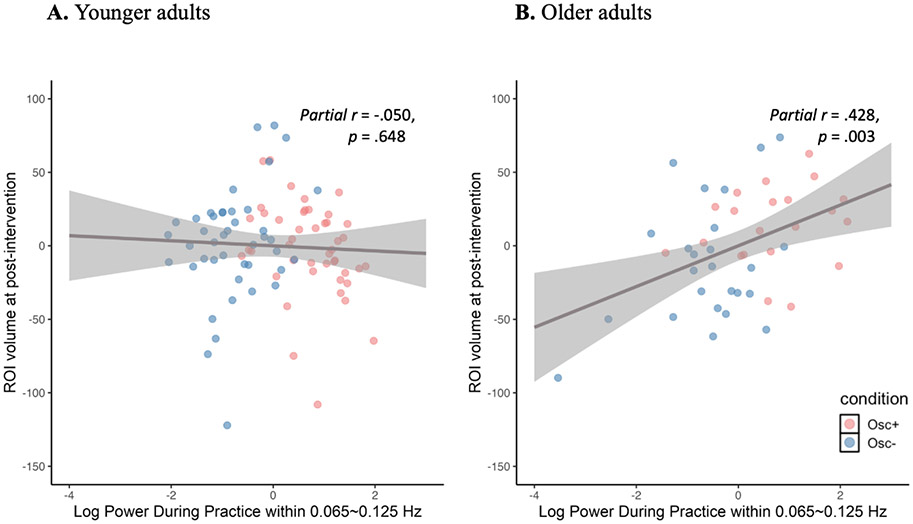
Fig 4. Scatterplot of the partial correlation between heart rate oscillatory activity during training and volume in the LC-innervated-regions hippocampal ROI at post-intervention when controlling for pre-intervention ROI volume.
The solid lines represent the fitted regression line, and the shadowed areas represent the 95% confidence interval. Both the X and Y were adjusted for pre-intervention ROI volume in the partial correlation model.

