
Fig. 1. Workflow and effective verification of MAPS-iTSA.
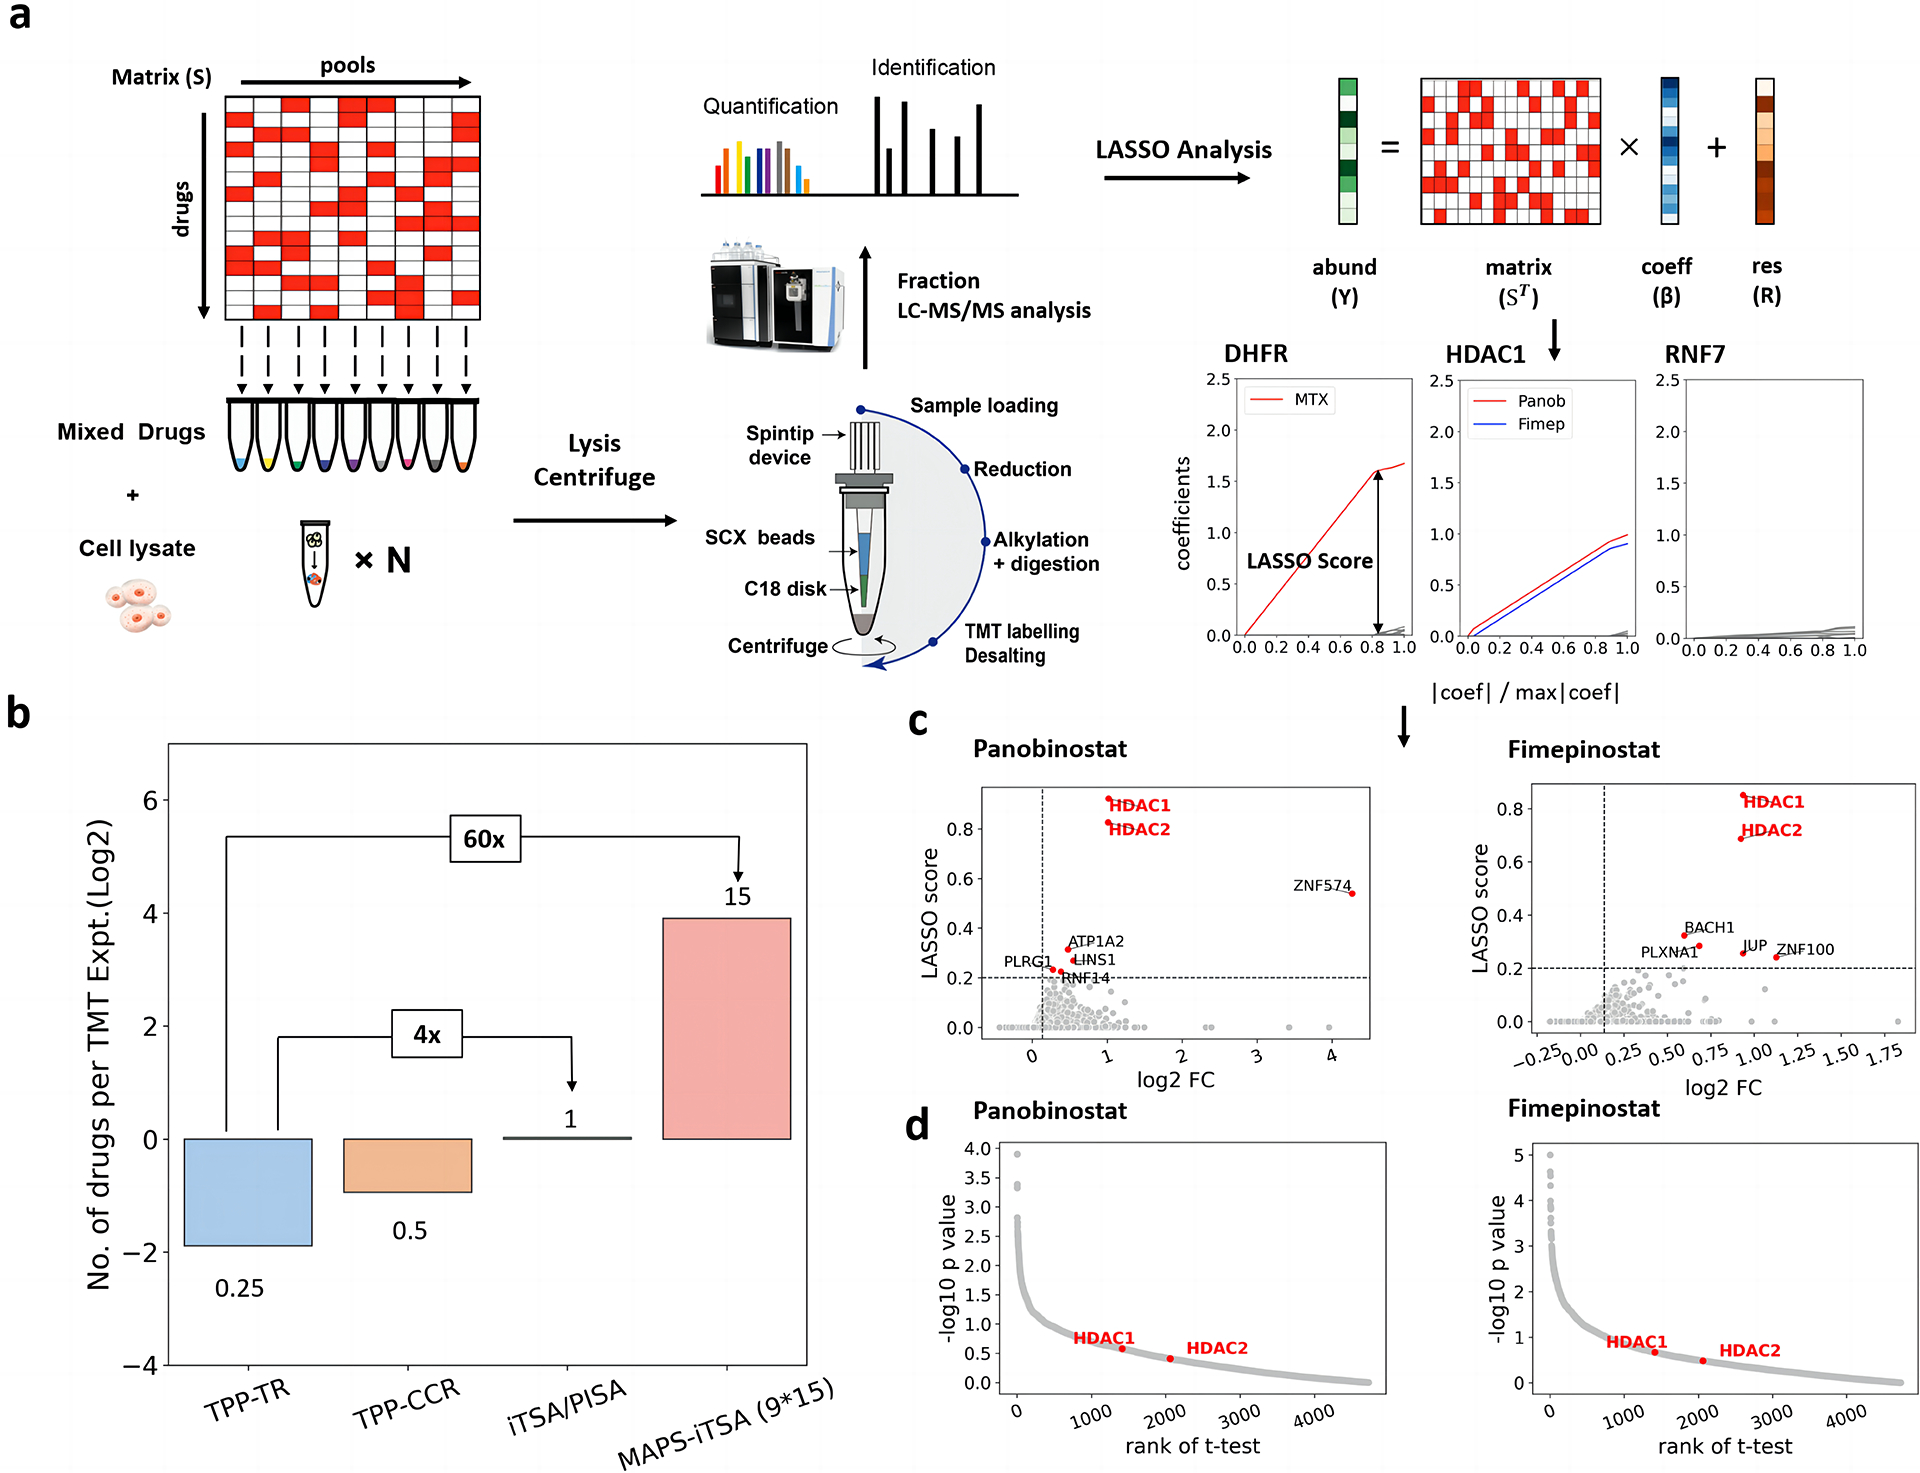
a. Illustrative application of the MAPS-iTSA workflow involves target deconvolution. The 9×15 binary sensing matrix is optimized for mixing the testing drugs. The value of 1 means put the corresponding drug into the tube containing cell lysate. Subsequently, the mixtures are incubated under specific temperature (e.g., 52 °C) followed by protein extraction, labelling and quantification. The normalized vector of the concentrations of the target protein is used for the LASSO analysis. Through LASSO analysis, the coefficient values quantify the contributions of the drugs to the variation in thermal stability of the protein. By increasing the penalty, the coefficients computed for the various drugs will progressively decrease to zero. For each protein, the LASSO score of each drug is defined as the corresponding coefficient value when only three non-zero values remained. b. Bar charts comparing the number of drugs that can be analyzed by a TMT experiment for TPP-TR, TPP-CCR, iTSA, PISA and pooled TPP/iTSA. c. LASSO score calculated from the path of coefficients compared with the fold changes reveal that HDAC1 and HDAC2 are the targets of panobinostat and fimepinostat. d. Scatter plots of the p-values and the ranking of the true targets indicate t-test cannot handle two drugs share the same targets.