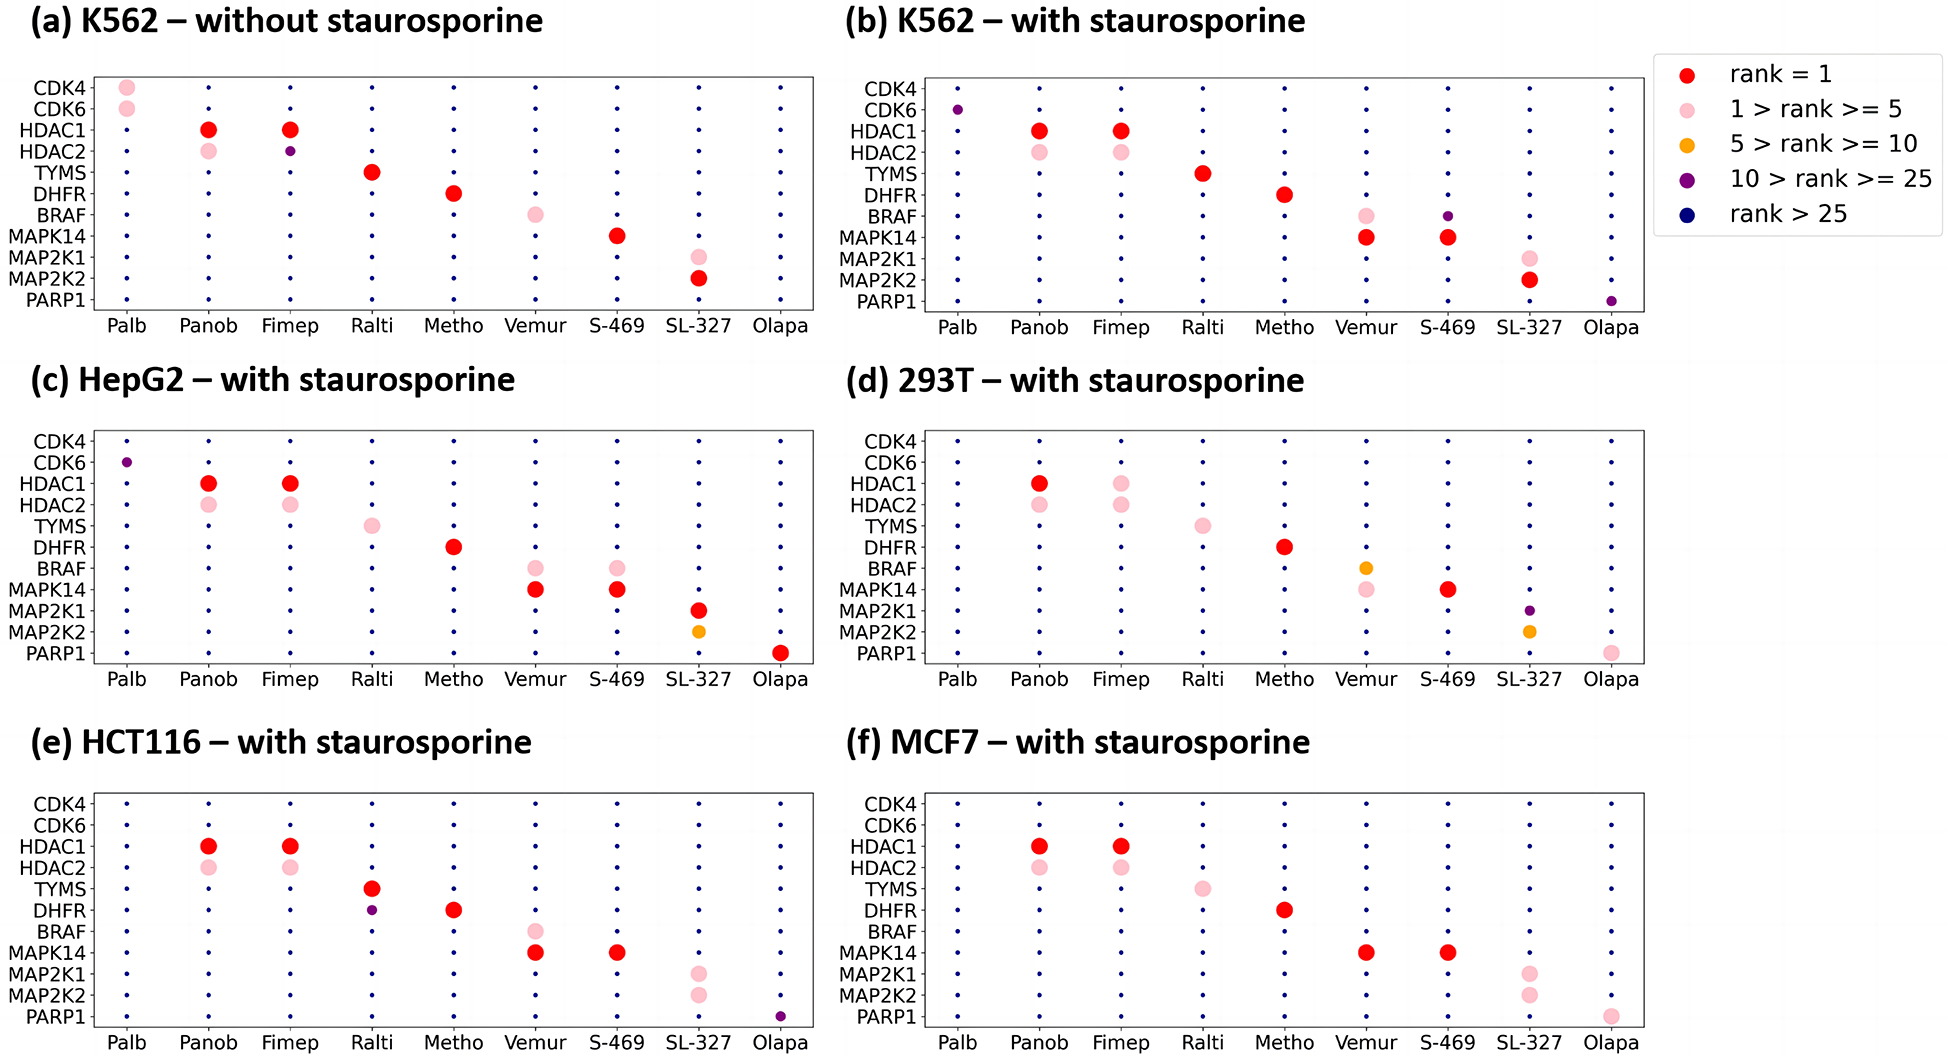
Fig. 2. Cell type specific drug target verification.

In each subplot, the x-axis represents the drugs, the y-axis represents the targets, and the color of the points represent the ranking of the target deconvolution based on LASSO score.

In each subplot, the x-axis represents the drugs, the y-axis represents the targets, and the color of the points represent the ranking of the target deconvolution based on LASSO score.