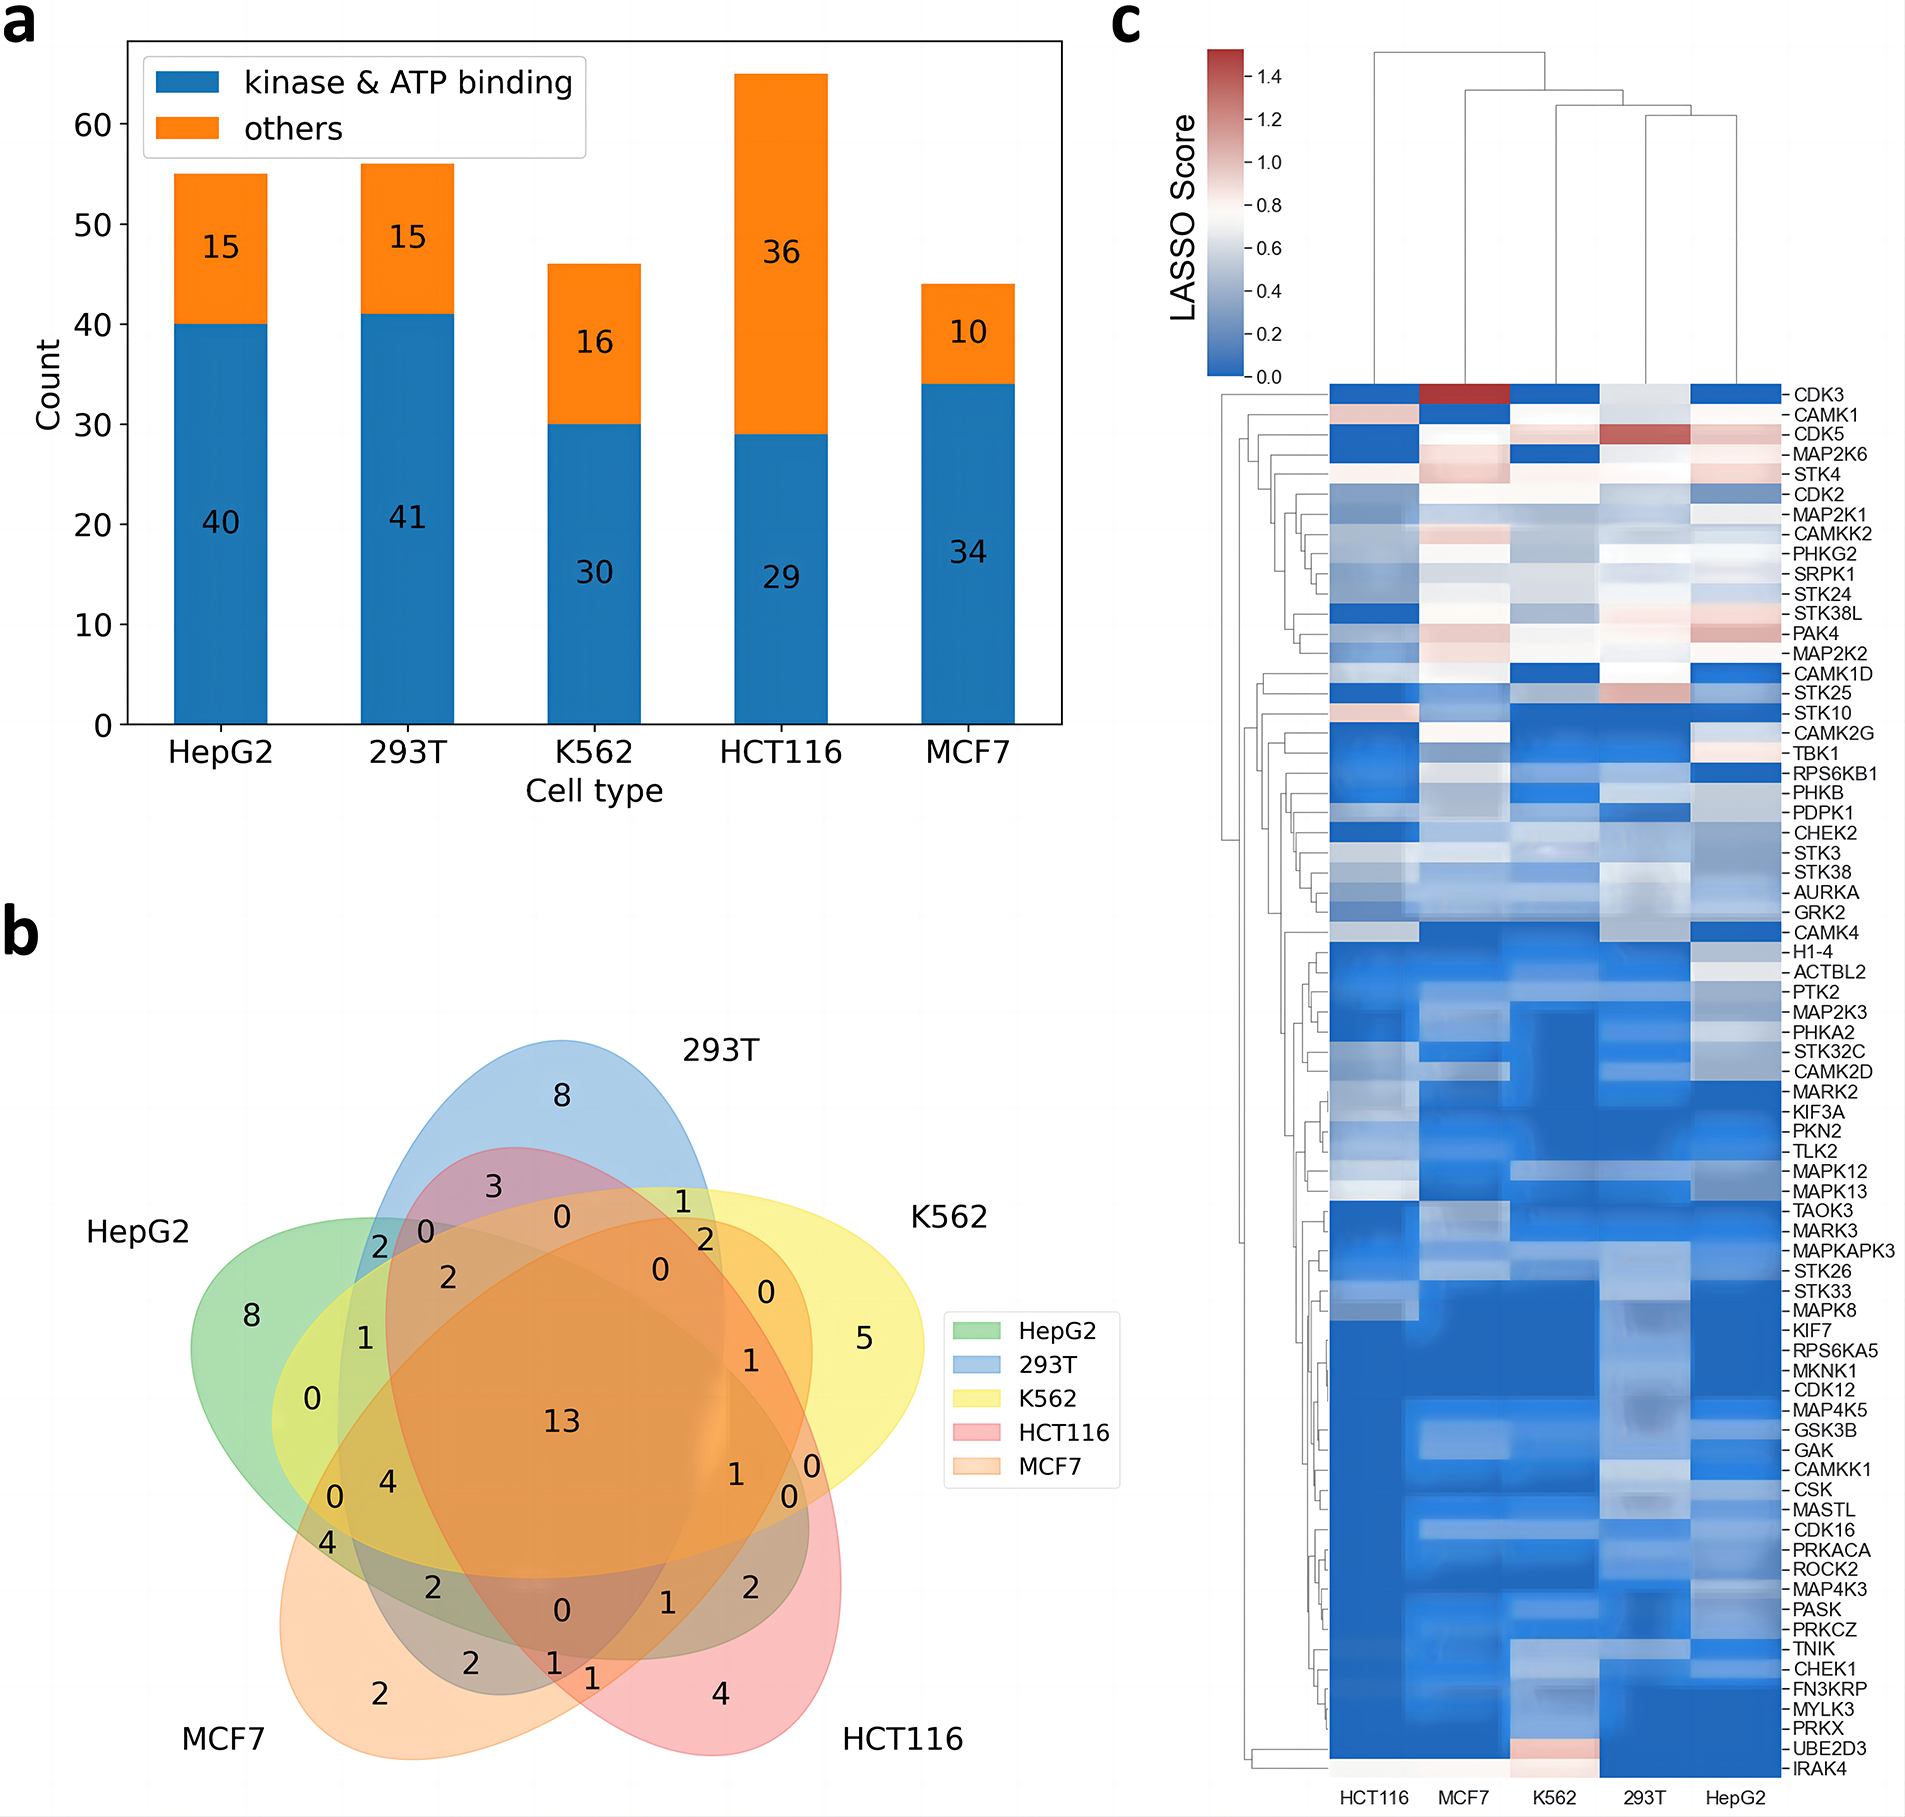
Fig. 3. Target deconvolution result of staurosporine.

a. Bar charts of the number of identified targets in different cell types. b. Venn plot of the identified kinases or ATP binding proteins of the different cell types. c. Correlation based heatmap of the identified kinases or ATP binding proteins, the color scale indicates the LASSO score.
