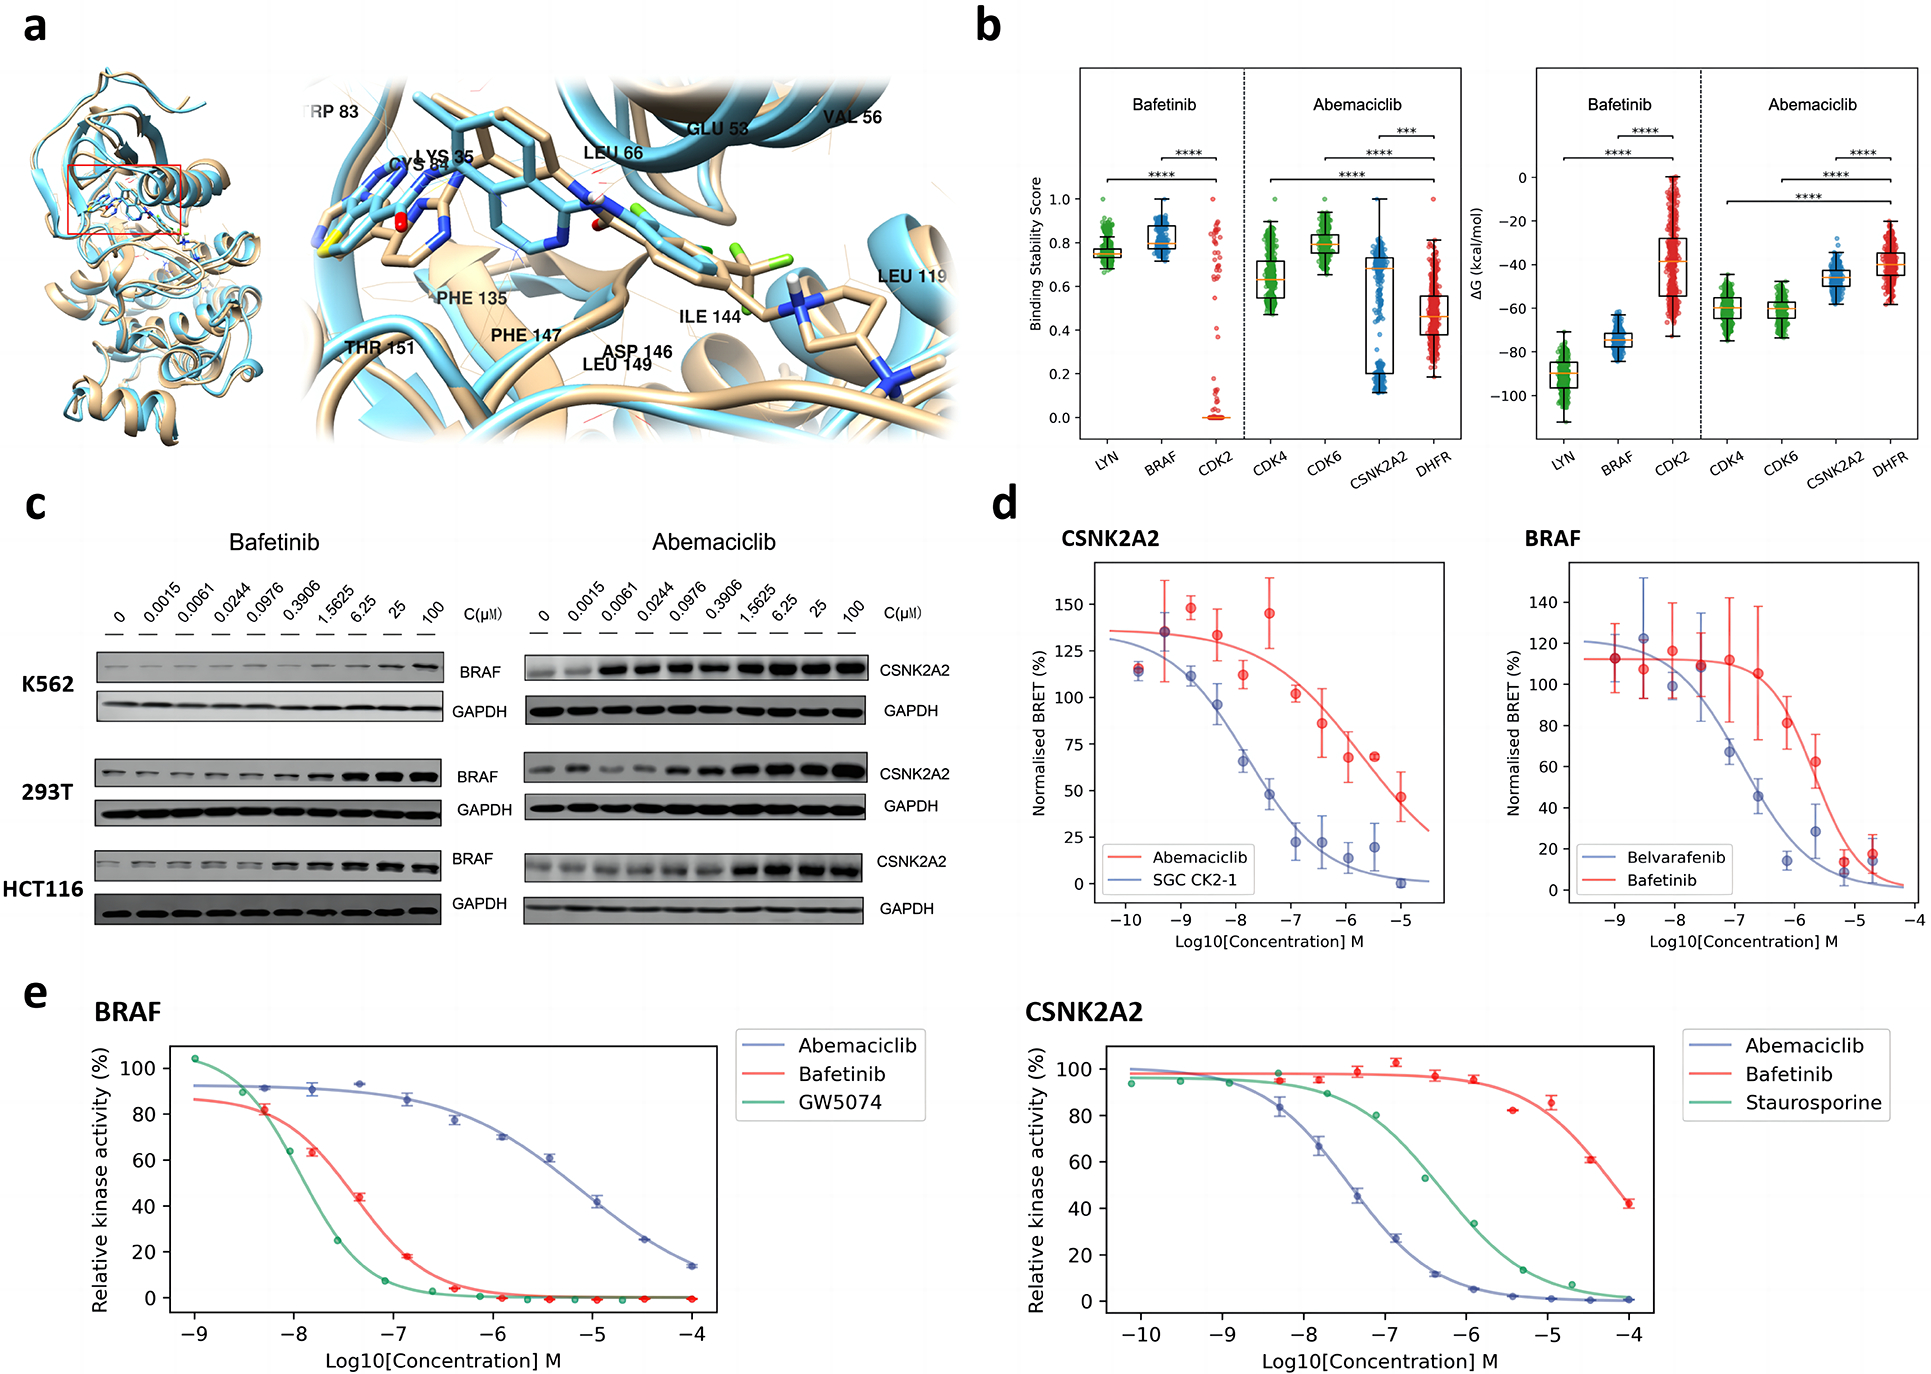
Fig. 5. Off target explanation and validation.

a. Binding mode comparison between bafetinib and belvarafenib in complex with BRAF. The structure closest to the average structure (measured by RMSD) of bafetinib-BRAF MD simulations is displayed in brown; The co-crystal structure of belvarafenib-BRAF (PDB ID: 6XFP) is displayed in cyan. b. Comparison of binding stability scores (left) and MMPBSA binding free energies (right) of the last 150 ns of MD simulation trajectories (frame interval is 1 ns). Positive controls are displayed in green; Negative controls are displayed in red; Identified off-targets are displayed in blue. Significance levels of z-tests: ***, p <= 0.001; ****, p <= 0.0001. c. Western blot of dose-dependent CETSA of abemaciclib-CSNK2A2 and bafetinib-BRAF. The changing of blots is consistent to the LASSO score of MAPS-iTSA. d. Dose-response curve for NanoBERT in-vitro off-target validation of bafetinib-BRAF and abemaciclib-CSNK2A2. Known inhibitors are taken as positive control while their cross matching is taken as negative control. e. Dose-response curve for kinase hotpots in-vitro off-target validation of bafetinib-BRAF and abemaciclib-CSNK2A2. Relative kinase activities are obtained by normalization based on blank controls.
