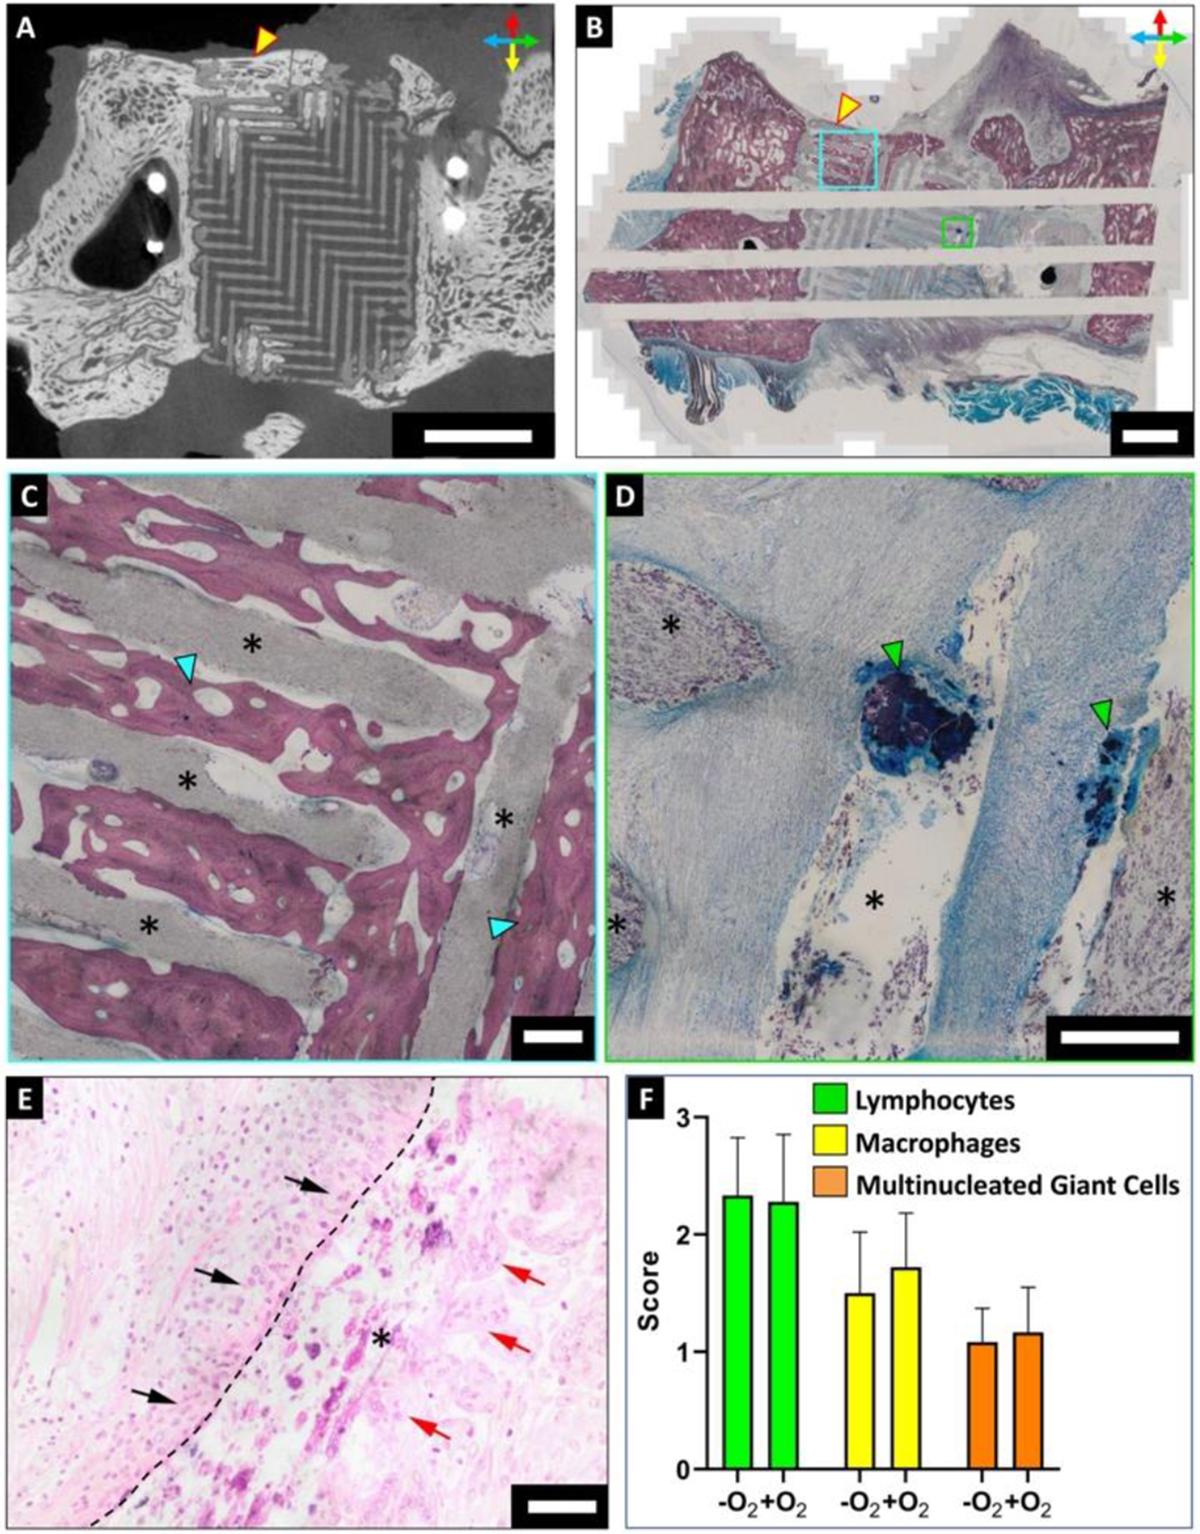
Figure 3: Histology at 12 months revealed the presence of lamellar bone and mild local inflammation within the scaffolds.

(A) μCT scan of harvested zygoma specimens confirmed osteoconductive bone infiltration into the scaffold. Scale bar = 10 mm. Orientation arrows: dorsal (red), ventral (yellow), rostral (blue) and caudal (green). (B-D) Stevenel’s Blue staining of undecalcified tissue specimens demonstrated osteoconductive bone growing on the periphery of scaffolds and infiltrating into the scaffold pores (cyan box; (C)). Bone nodules nucleating within the scaffold pores by osteoinduction were also observed (green box; (D)). Scale bar = 5 mm. (C, D) Magnified images of cyan and green boxes of (B) respectively, where asterisks denote scaffold struts. Scale bar = 500 μm. (E) H&E staining of undecalcified zygomatic specimens indicated the presence of immune cells within the scaffolds. Lymphocytes (black arrows) and multinucleated giant cells (red arrows) were found in close association with the scaffold strut (asterisk). Dashed line outlines the scaffold strut boundary. Scale bar = 50 μm. (F) Semi-quantitative scoring of H&E stained sections for assessing presence of lymphocytes, macrophages, and multinucleated giant cells within the scaffolds. Scores indicate: 0 = absent, 1 = rare, 2 = mild infiltrate, 3 =moderate/heavy infiltrate, 4 = packed infiltrate/sheets for MNGCs.
