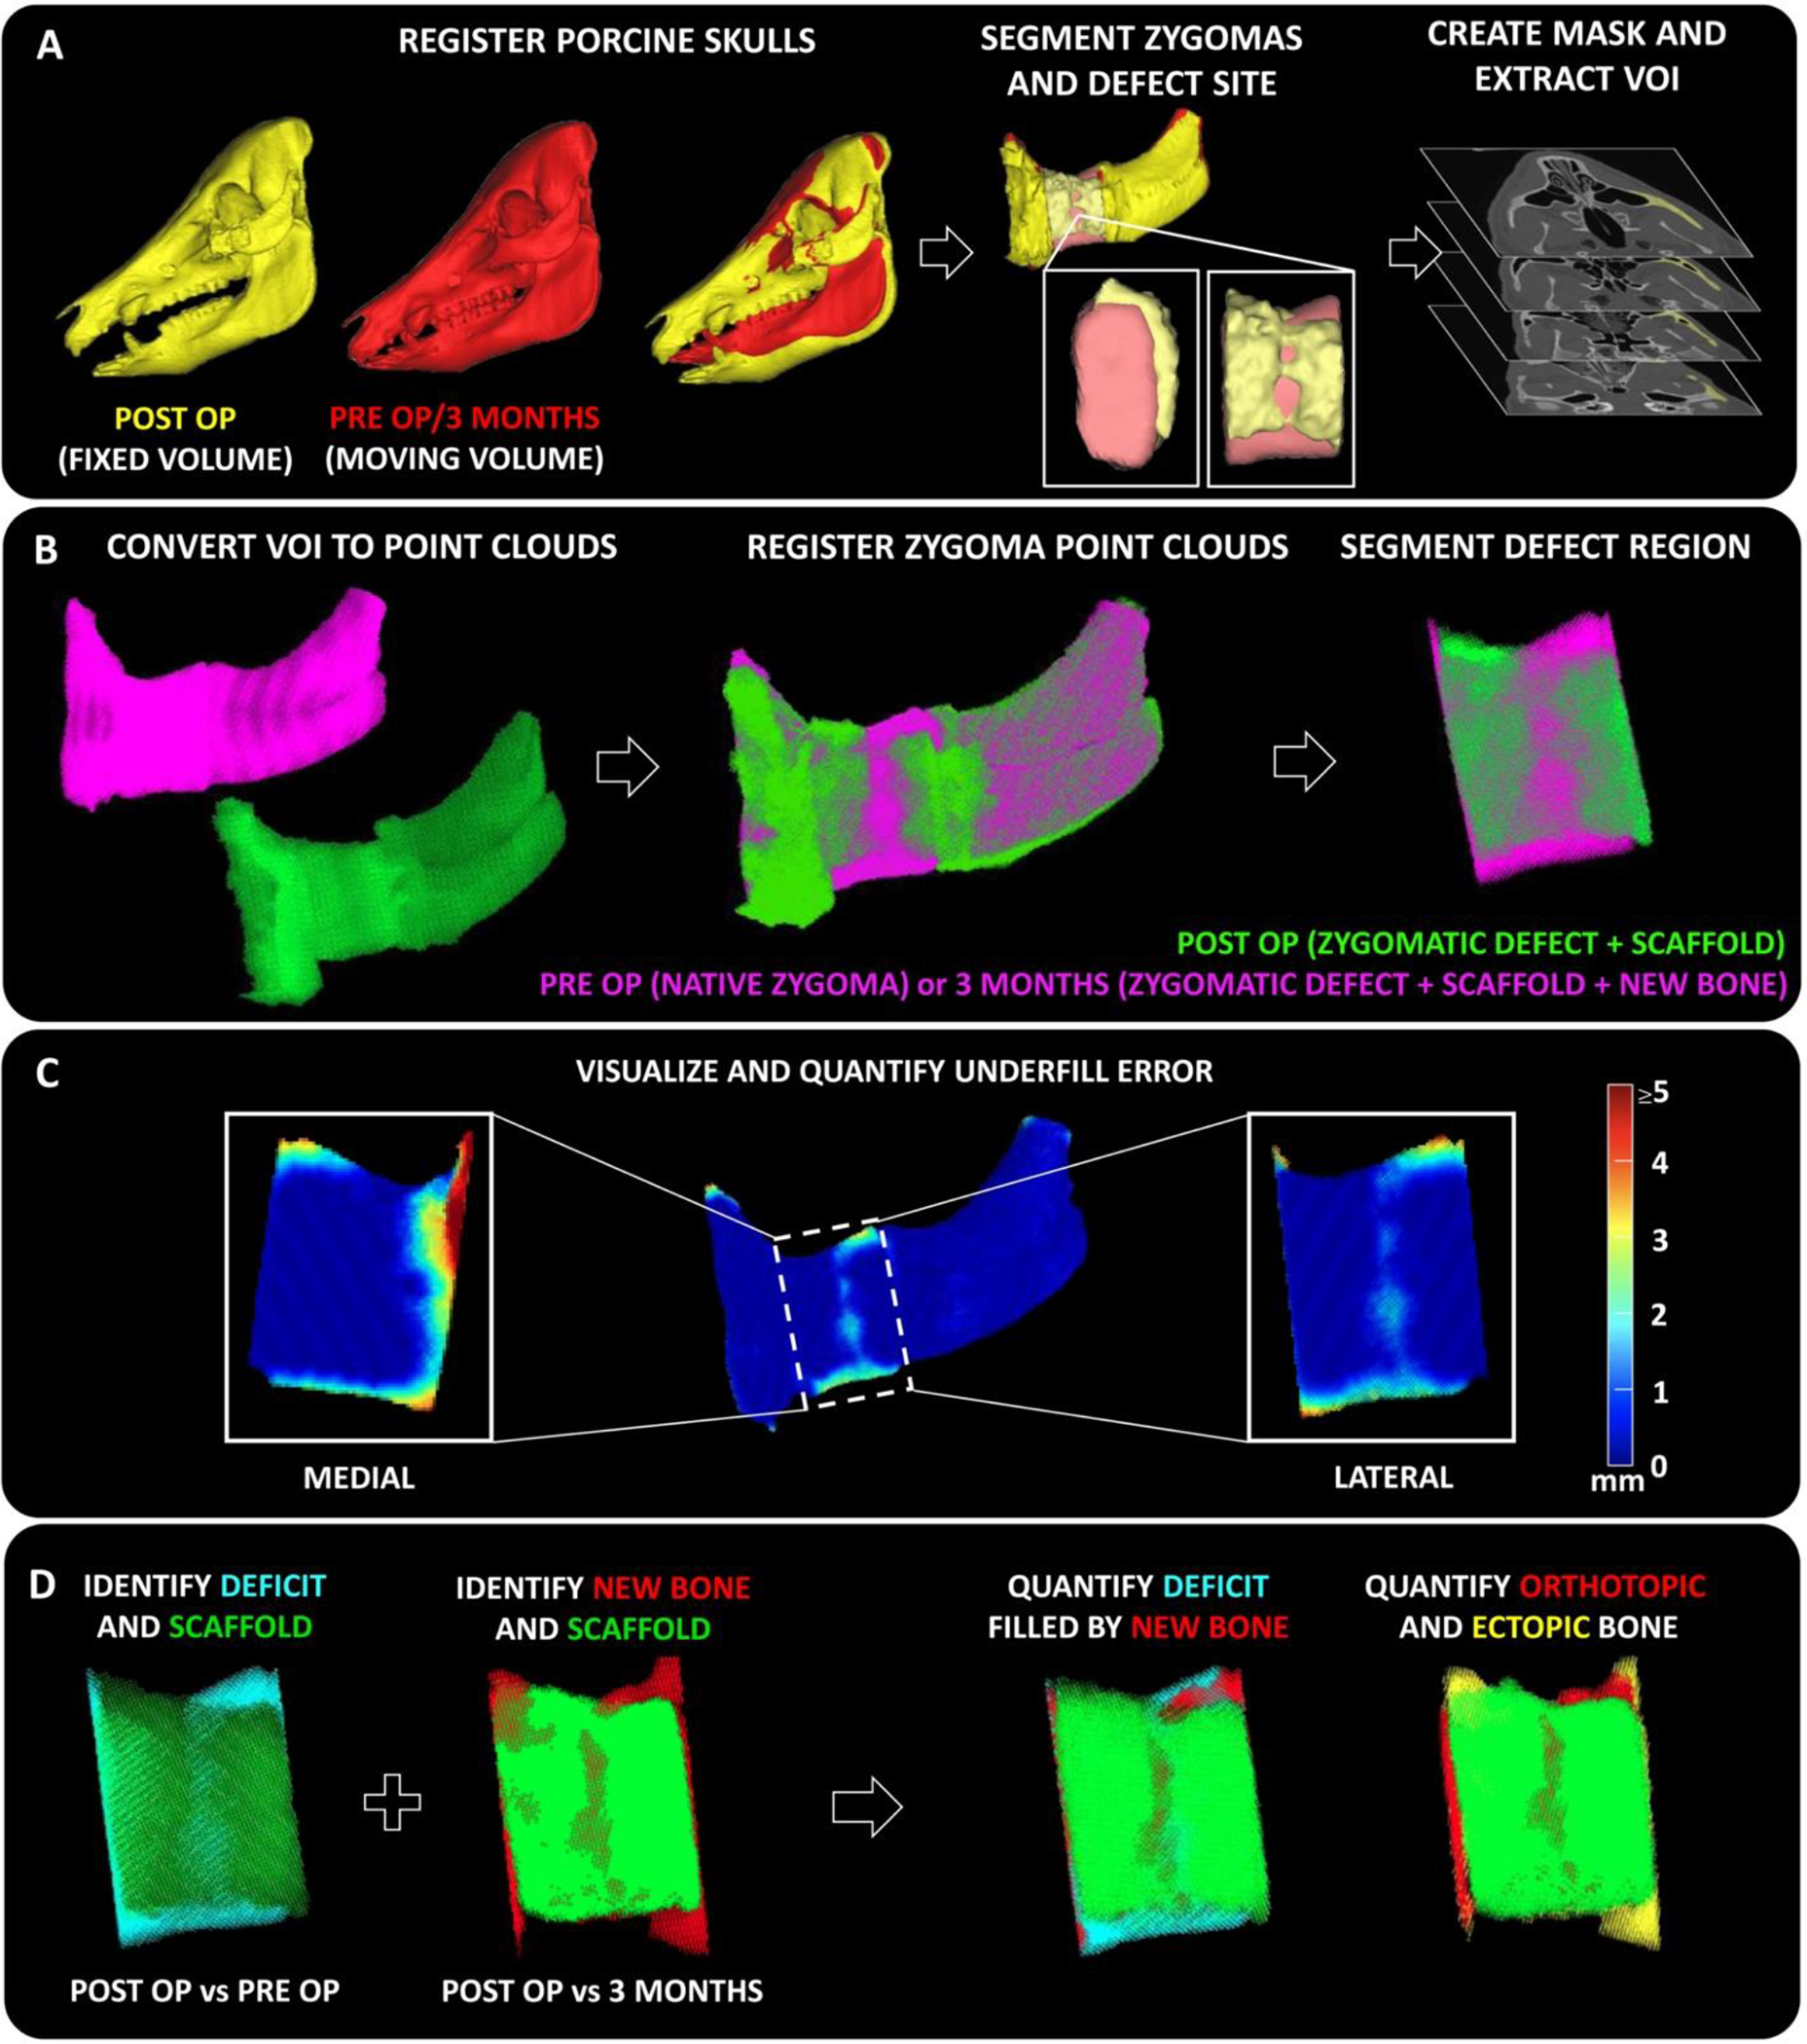
Figure 4. Quantifying 3D geometric mismatch and spatial patterns of bone regeneration at defect sites.

(A) Pre-operative and post-operative CT scans of the animal skulls were registered using Mimics software to segment out corresponding defect bone regions containing the scaffolds. Masks of the respective volume of interest (VOI) were created as bitmaps (.bmp). (B) The bitmaps were imported into MATLAB® and converted into point cloud objects and re-registered at a higher resolution using independent iterative closest point algorithm (I-ICP10)[23] (C) From the registered zygomatic point clouds, areas of anatomical mismatch (underfill) were visualized and their corresponding magnitudes were quantified at the defect site. Heatmap demonstrates magnitude of underfill at each point. (D) Regions of deficit (underfill, post op vs pre op) and new bone growth (overfill, post op vs 3 months) at the defect site were identified and superimposed spatially to quantify the amount of orthotopic or ectopic bone and calculate the amount of deficit region filled by new bone.
