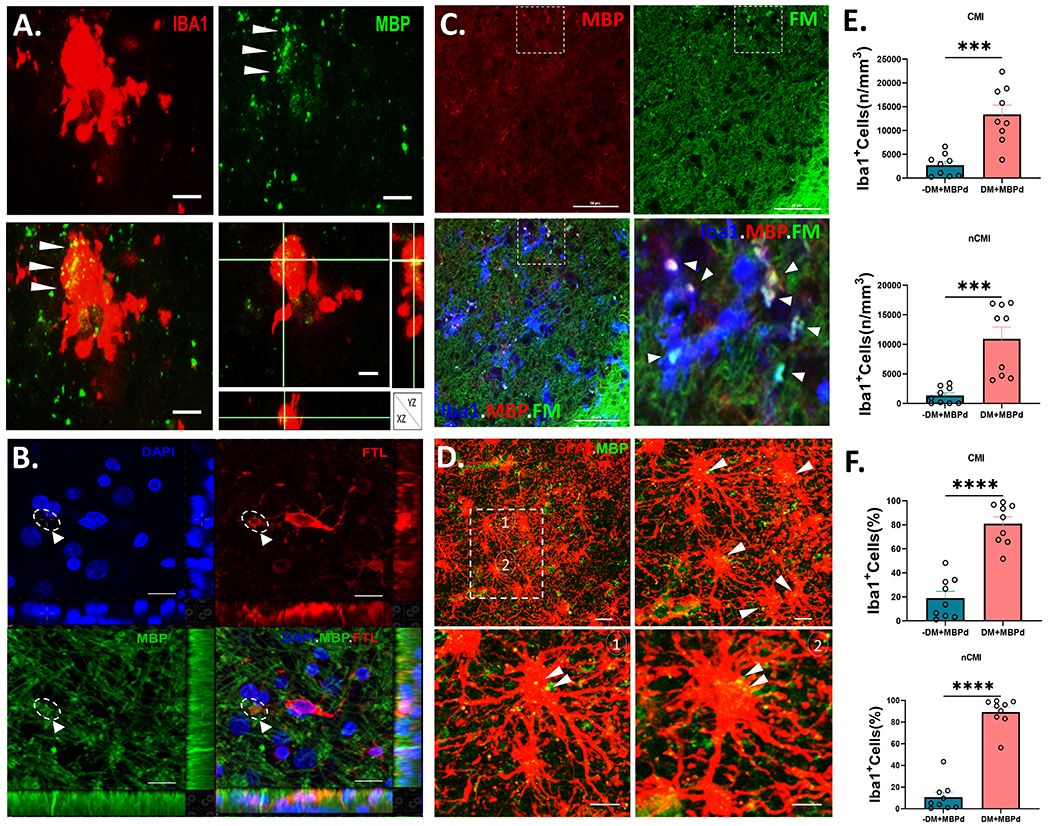
Fig. 1.

Degenerative microglial (DM) phagocytose myelin debris. (A) A typical Iba1+ DM (red) with a paucity of shrunken processes. Myelin debris (MBPd; green), visualized by staining for myelin basic protein (MBP), was extensively colocalized in the DM soma (merged; arrowheads), as confirmed in the orthogonal views. Scale bars, 20 μm. (B) Example of a DM visualized with ferritin light chain (FTL; red) that extends a prominent phagosome containing myelin debris visualized with MBP (green; arrowhead). DAPI counterstain (blue). See also supplemental figure 2 for a video reconstruction of this cell visualized by 3-D confocal microscopy. Scale bars, 50 μm. (C) Typical example of extensive co-localization of myelin debris in Iba1+ microglia (blue) double-labeled with FluoroMyelin™ (FM; green) and immunostaining for MBP (red). The boxed region in the triple-labeled panel at lower left is shown in higher detail in the lower right panel and shows the extensive distribution of myelin debris in and around the microglia (arrowheads). Scale bars, 10 μm. (D) Typical appearing reactive astrocytes visualized with GFAP (red) in a demyelinated white matter lesion with a striking lack of myelinated fibers labeled with MBP (green). Inset shows two hypertrophic astrocytes (1 and 2) shown at higher magnifications, that contain scattered puncta of MBPd (yellow; arrowheads). Scale bars, 30 μm. (E and F) Stereological counts of the density and percentage of total Iba1+ microglia that co-localized MBPd among nondegenerative microglia (-DM; teal) vs. DM (salmon) for cases diagnosed with cerebral microinfarcts (CMI) in E and cases lacking CMI’s (nCMI) in F. Student’s t-test, ***p<0.001; ****p<0.0001.
