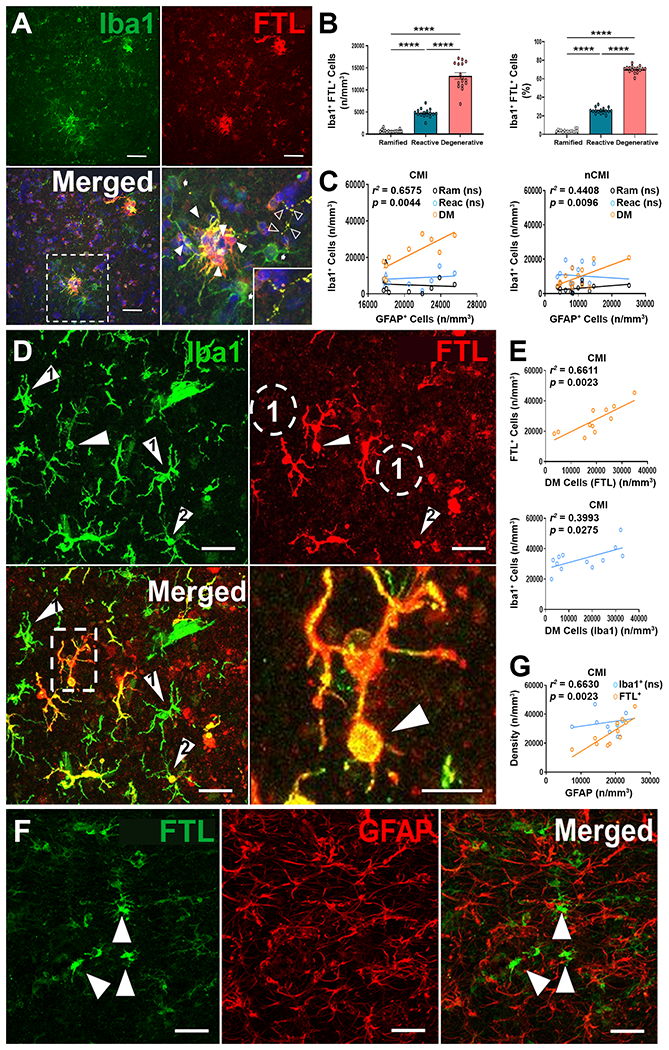
Fig. 2.

Degenerative microglia (DM) are iron-enriched and selectively express light chain ferritin (FTL). (A) A subset of Iba1+ microglia (green) label for the iron-binding protein light chain ferritin (FTL; red). A higher magnification detail of the boxed region in the merge image is shown on right. Note clusters of DM (closed arrowheads), which label for FTL, whereas non-degenerative microglia (arrows) label for Iba1 but not for FTL. An intensely labeled fragmented DM process is seen at the upper right (open arrowheads) and shown in the inset at lower left. Scale bars, 50 μm. (B) Density and percentage of ramified (Ram), reactive (Reac), and Degenerative (DM) microglia that were Iba1+FTL+. Note that FTL+DM comprised the major population of microglia in WM lesions. ****p<0.0001; ANOVA with Tukey’s post hoc test. (C) DM but not ramified or reactive microglia were significantly associated with the magnitude of WMI quantified as the density of GFAP+ astrocytes (r2=0.6575; p=0.0044). (D) Microglia labeled for Iba1 (green) and FTL (red) display considerable heterogeneity in terms of iron labeling. Note examples from the subset of non-degenerative microglial (green only; arrowhead #1) that do not label with FTL, with their location noted in the ferritin image as dashed circles (#1). In contrast, in the merge image, numerous DM are visualized (red/yellow) which varied from FTL labeling restricted to the soma (arrowhead #2) to extensive labeling of the processes. Note FTL+ DM with swollen phagosome (dashed box), which is shown at right at higher magnification (arrowhead indicates the phagosome). Scale bar, 50 μm. (E) FTL is a superior marker for DM when compared to DM identified by morphology using Iba1 alone. A plot of total FTL+ microglia vs. FTL+ DM yielded a more significant association (r2=0.6611; p=0.0023) when compared with analysis using Iba1 alone (r2=0.3993; p=0.0275). (F) FTL (green) does not label GFAP+ astrocytes (red) in WM lesions. Note in the merged image that FTL+ DM (green; arrowheads) were distinguished from astrocyte labeling (red). Scale bars, 50 μm. (G) Total FTL+ DM are significantly associated with the magnitude of WMI, defined as the density of GFAP+ astrocytes (r2=0.0.6630; p=0.0023), whereas no significant association is seen for total Iba1+ microglia.
