Fig. 5.

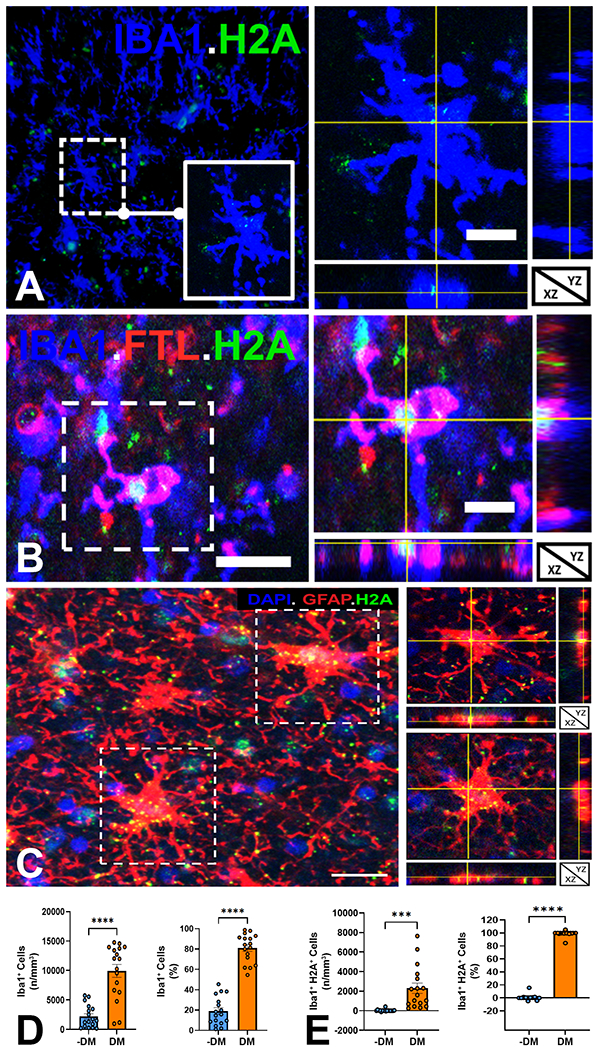
Microglia in white matter lesions sustain DNA damage. (A) Low power view of Iba1+ microglia (blue) stained for DNA double strand breaks with phospho-histone H2A.X (H2A, green). Inset and orthogonal views of a microglia cell with scattered H2A staining consistent with a low level of DNA damage. Scale bars, 30 μm. (B) Detail and orthogonal views of a typical Iba1+ (blue) FTL+ (red) DM with truncated and shrunken processes and intense H2A labeling (arrowheads) consistent with a high level of DNA damage. Scale bars, 30 μm. (C) Low power view of a lesion with several reactive astrocytes (GFAP+, red). Orthogonal views of two cells (dashed boxes) with H2A labeling (green) and DAPI (blue). Scale bars, 30 μm. (D) The density and percentage of DM in white matter lesions was significantly higher than nondegenerative microglia (-DM). (E) The density and percentage of microglia that stained for DNA damage with H2A in white matter lesions was significantly higher for DM compared to nondegenerative microglia (-DM). Because there were no significant differences between CMI and nCMI cases, data was analyzed as the full cohort of 17 cases in D and E. Student’s t-test; ***p< 0.001; ****p<0.0001 in D and E.
