FIGURE 6.

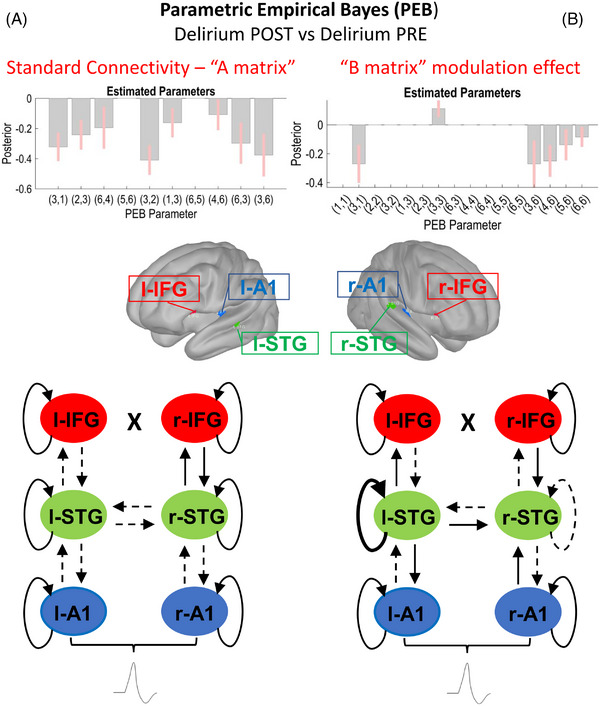
Secondary outcome: comparison of postoperative (Delirium POST, N = 19) and preoperative data (Delirium PRE, N = 16). Schematic display of the results of the parametric empirical Bayes (PEB) analysis following the dynamic causal modeling (DCM) based estimation (i.e., fitting the winning model to the individual data, to get estimates of the parameters). The PEB model has parameters encoding the deviation from the mean due to the group difference (covariate 2). For the two‐condition difference, positive estimated parameters indicate stronger connectivity in first group than second group and negative parameters indicate the opposite. Posterior probabilities > 95% (corresponding to a strong evidence level) for the deviance detection effect of interest are shown. Sources #: (1) left A1; (2) left IFG; (3) left STG; (4) right A1; (5) right IFG; (6) right STG. In the diagrams, dashed and thicker lines for internodal connections mean decreased and increased connectivity, respectively. In case of curved lines for intrinsic nodal inhibition, thicker and dashed lines mean increased and decreased inhibition, respectively. (A) Left section: Standard tone connectivity analyses (“A matrix”) for the difference between postoperative (Delirium POST, N = 19) and preoperative data (Delirium PRE, N = 16). PEB results interpretation (increase/decrease in connection strength): left A1 → left STG (decreased in Delirium), left STG → left IFG (decreased in Delirium), right A1 → right STG (decreased in Delirium), left IFG → left STG (decreased in Delirium), left STG → left A1 (decreased in Delirium), right STG → right A1 (decreased in Delirium), left STG → right STG (decreased in Delirium). right STG → left STG (decreased in Delirium). (B) Right section: Difference between oddballs and standards (“B matrix”) modulation effect for the difference between postoperative (Delirium POST, N = 19) and preoperative data (Delirium PRE, N = 16). PEB results interpretation (increase/decrease in connection strength): left A1 → left STG (decreased in Delirium), left STG (increased self‐Inhibition in Delirium), right STG → left STG (decreased in Delirium), right STG → right A1 (decreased in Delirium), right STG → right IFG (decreased in Delirium), left STG (decreased self‐Inhibition in Delirium). A1, primary auditory sensory area; IFG, inferior frontal gyrus; STG, superior temporal gyrus
