Figure 1:

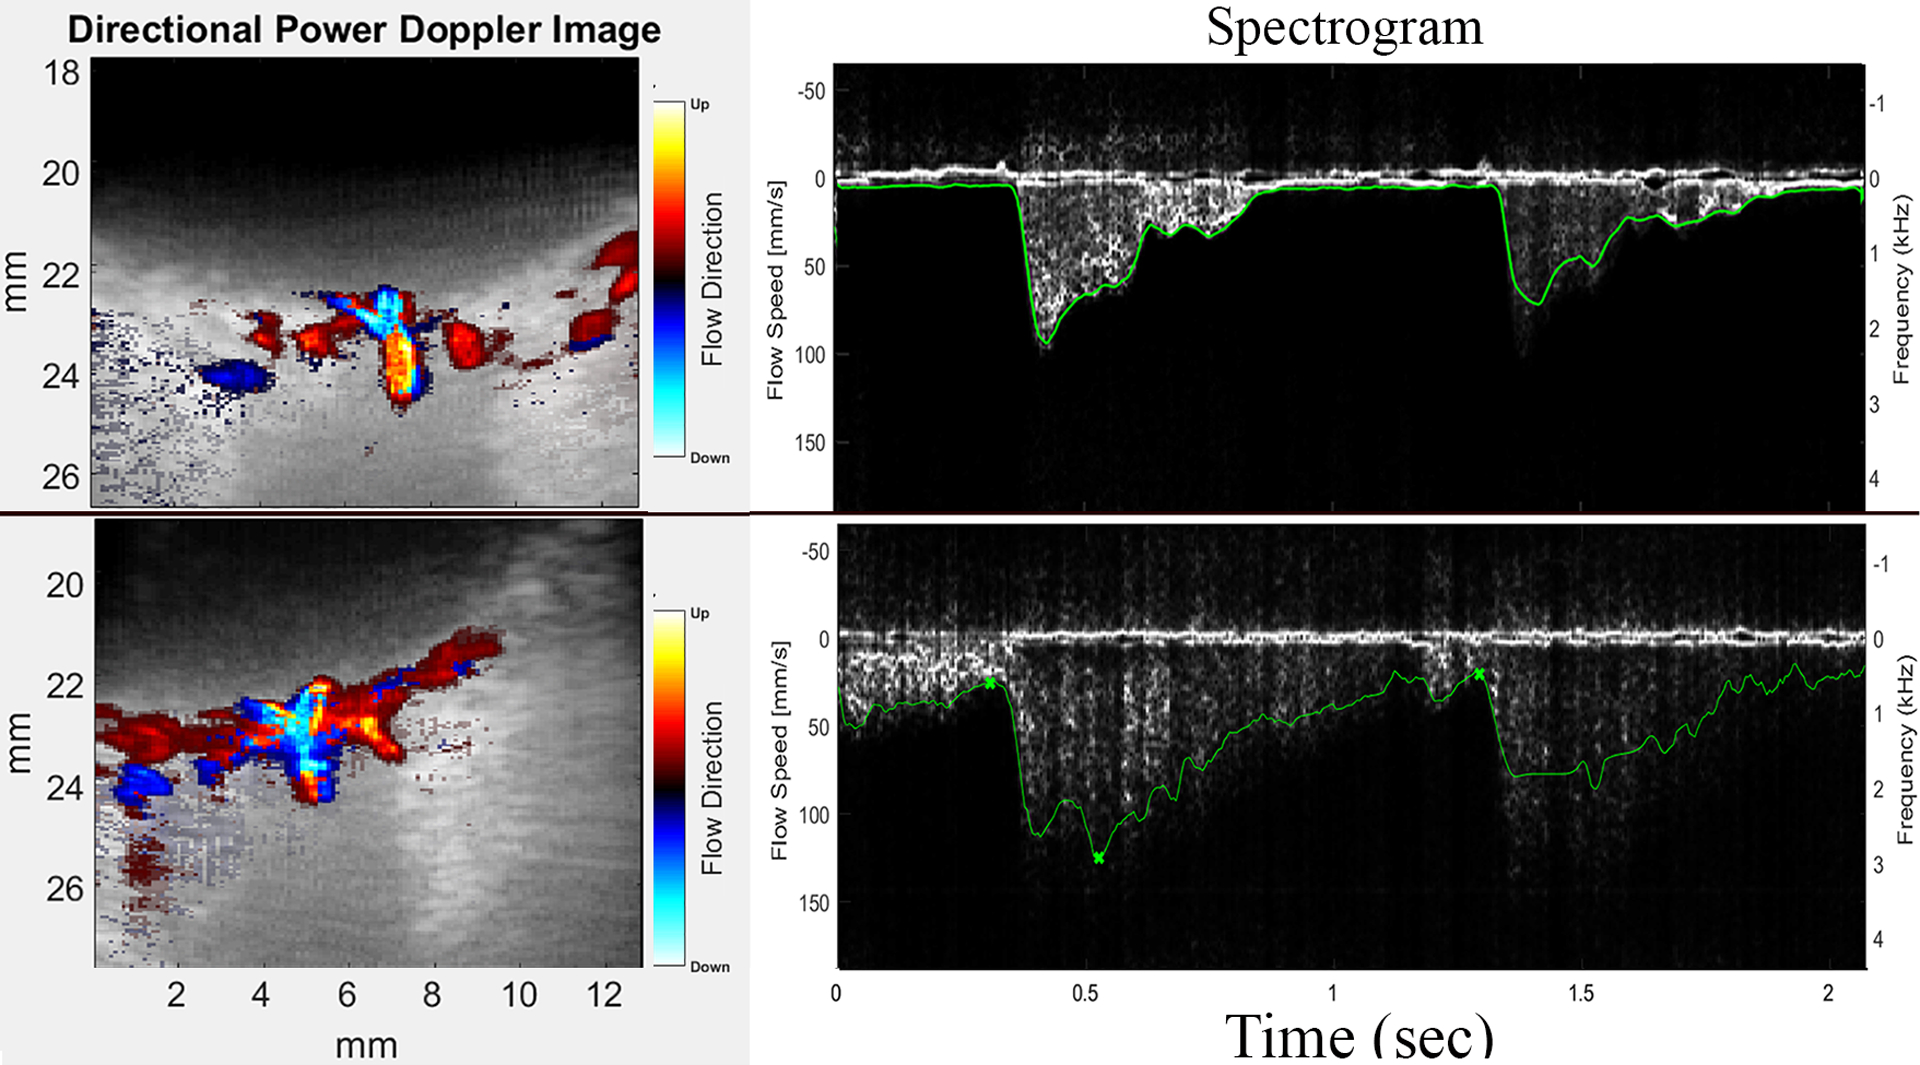
Representative PWU color-flow images and spectrograms from a control (top) and an sPE subject (below). Note comparatively high end-diastolic flow velocity corresponding to reduced resistance in sPE.

Representative PWU color-flow images and spectrograms from a control (top) and an sPE subject (below). Note comparatively high end-diastolic flow velocity corresponding to reduced resistance in sPE.