Figure 2:

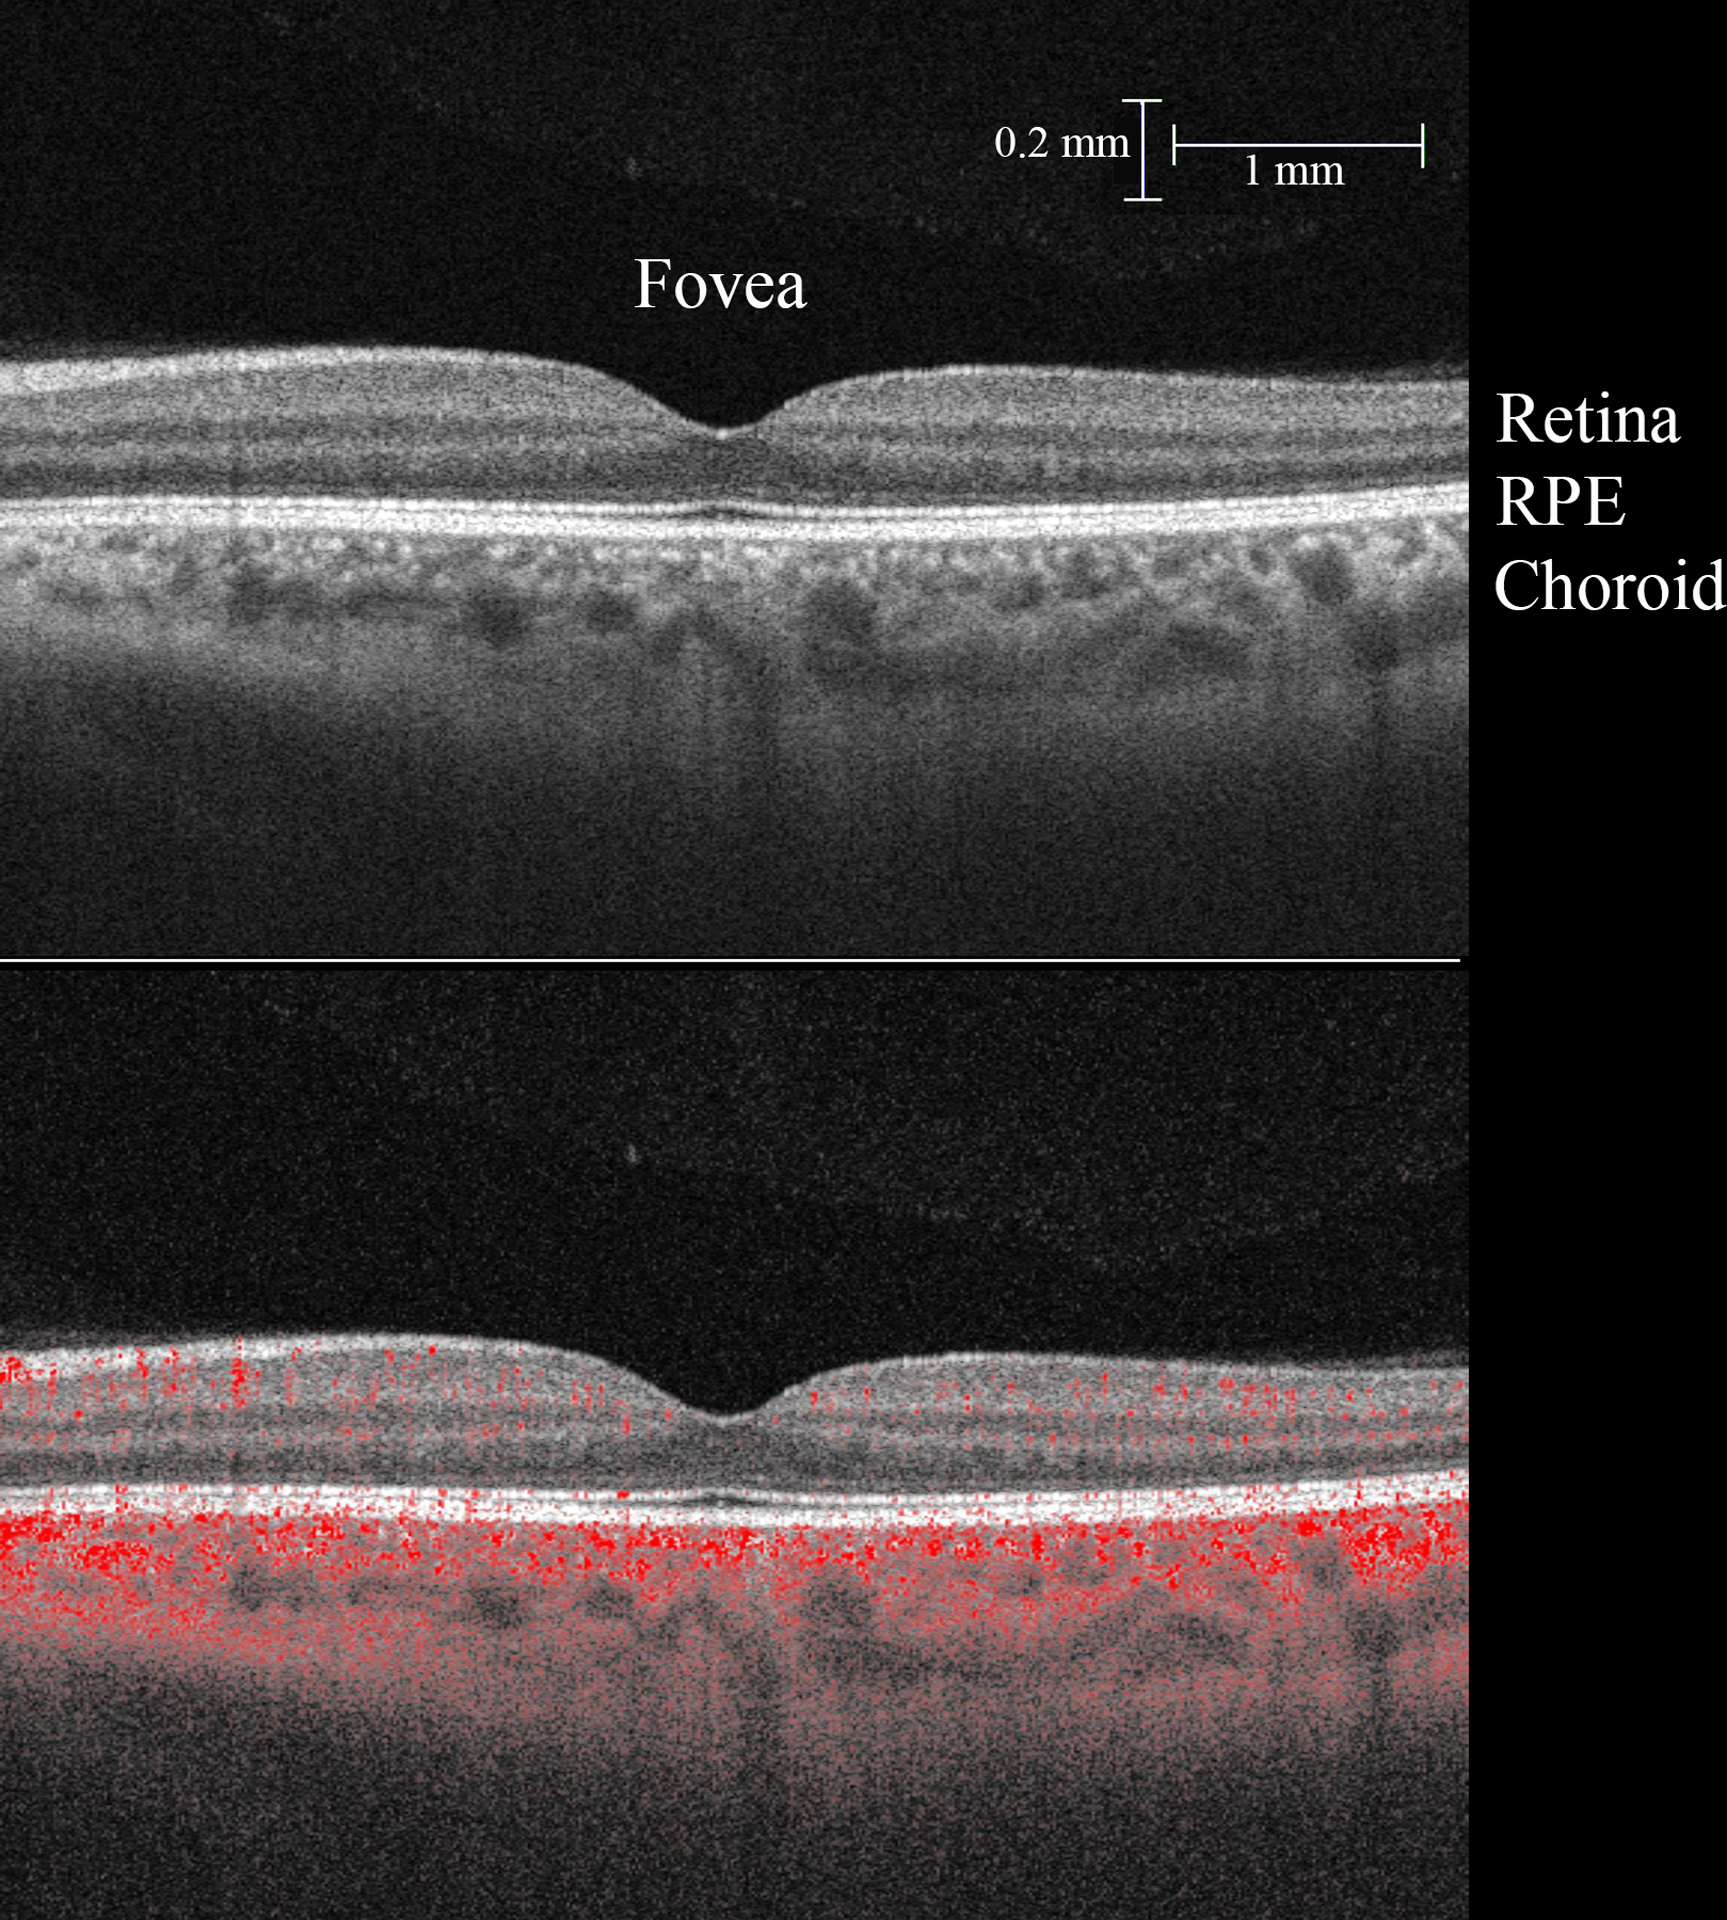
Top: Representative perifoveal OCT B-scan. Below: Areas of signal decorrelation representing flow are superimposed in red over the grey scale B-scan. (RPE, retinal pigment epithelium)

Top: Representative perifoveal OCT B-scan. Below: Areas of signal decorrelation representing flow are superimposed in red over the grey scale B-scan. (RPE, retinal pigment epithelium)