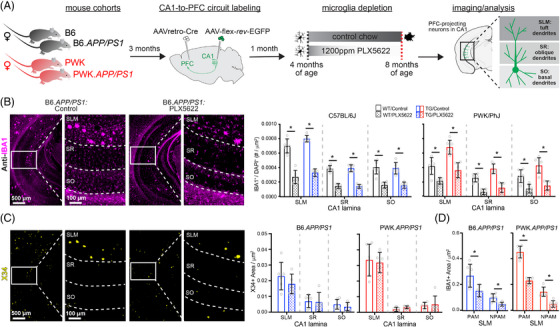
FIGURE 1.

Evaluation of microglia composition and amyloid pathology across CA1 in WT and TG APP/PS1 mice. A, Experimental outline (see Methods section for additional details). B, IBA1+ microglia from B6.APP/PS1 TG control and PLX5622 mice (left). Quantification of IBA1+/DAPI+ microglia across CA1 lamina (right). Datapoints represent individual mice (n = 5–6/group); error bars are ± SD; asterisks denote comparisons (P < 0.05) identified between control and PLX5622 groups (right) after corrections for multiple comparisons. C, X34+ Aβ plaques in B6.APP/PS1 TG control and PLX5622 mice (left). Quantification of X34+ Aβ plaque area across CA1 lamina (right), plotted as described above. D, Quantification of IBA1+ area from SLM defined as PAM or NPAM. Points represent mean values calculated for individual mice and analyzed with two‐tailed nonparametric t tests. Statistical analyses performed on B6 and PWK separately. For (B)–(C) *adjusted P < 0.05 Bonferroni post hoc tests. For (D) *P < 0.05 nonparametric two‐tailed t test (Table S2 in supporting information). Aβ, amyloid beta; B6, C57BL/6J; DAPI, 4′,6‐diamidino‐2‐phenylindole; IBA1, ionized calcium binding adapter molecule 1; NPAM, non–plaque‐associated microglia; PAM, plaque‐associated microglia; PWK, PWK/PhJ; SD, standard deviation; SLM, stratum lacunosum moleculare; SR, stratum radiatum; SO, stratum oriens; TG, transgenic; WT, wild type.
