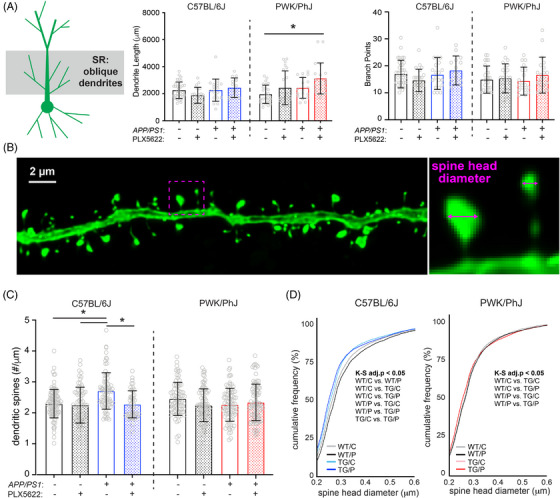
FIGURE 2.

Amyloid‐ and microglia‐dependent spine plasticity in oblique branches from B6 but not PWK mice. A, Oblique dendritic lengths (left) and branch points (right). Individual data points represent each reconstructed neuron (n = 3–5/mouse); error bars are ± SD; asterisks denote post hoc (P < 0.05) after two‐way ANOVA and corrections for multiple comparisons. B, Example deconvolved confocal image of an EGFP+ oblique branch. Spine density was acquired across dendrites (left) and individual spines measured for maximum head diameter (right). C, Oblique branch spine densities across genotype/treatment groups. Data points represent individual branches (n = 10–15/mouse); error bars are ± SD; asterisks denote comparisons (P < 0.05) identified between control and PLX5622 groups after two‐way ANOVA and corrections for multiple comparisons. D, Spine head diameter cumulative distributions from B6 (left) and PWK (right). K–S tests were used to evaluate statistical significance (see Table S3G‐H in supporting information), with significant (adj.P < 0.05) pairwise comparisons reported on the figure. Statistical analyses performed on B6 and PWK separately. For (A) and (C) *adjusted P < 0.05 Bonferroni post hoc tests (Table S3). ANOVA, analysis of variance; B6, C57BL/6J; EGFP, enhanced green fluorescent protein; K–S, Kolmogorov–Smirnov; PWK, PWK/PhJ; SD, standard deviation; SR, stratum radiatum; TG/C, APP/PS1 Control; TG/P, APP/PS1 PLX5622; WT/C, wild‐type control, WT/P, wild‐type PLX5622.
