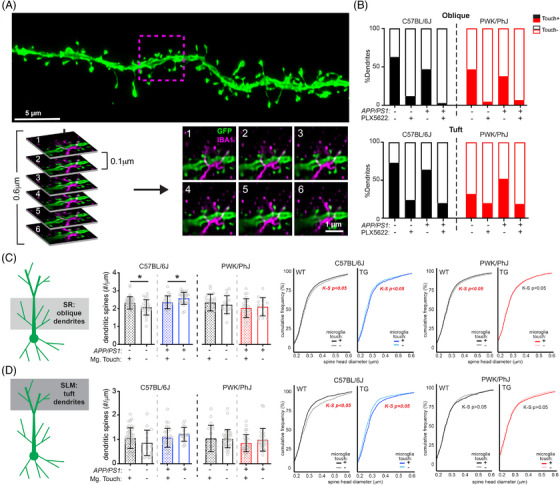
FIGURE 4.

Microglia–dendrite interactions shape spine density and morphology. A, Deconvolved confocal image of dendritic branch (green) with the region of microglia–dendrite interaction marked by a magenta box (top). Individual z‐slices from the stack (0.1 µm steps) with the IBA1+ microglia (in magenta) interacting with the EGFP+ dendrite (green) (bottom). Numbers in upper left hand denote z‐steps. B, Dendrite proportions that were classified as Touch+ or Touch– across oblique (top) and tuft (bottom) dendrites. C, Spine densities (left) and cumulative distributions for spine head diameters (right) from oblique Touch+ and Touch– dendrites. Data points represent individual branches and analyzed with unpaired t tests between Touch+ and Touch– branches from B6 (middle) and PWK (right). K–S tests were used to evaluate statistical differences (see Table S6 in supporting information). D, Identical analyses to (C) for tuft dendrites. See Table S7 in supporting information for statistics. For (C) and (D) *P < 0.05, unpaired t test. EGFP, enhanced green fluorescent protein; IBA1, ionized calcium binding adapter molecule 1; K–S, Kolmogorov–Smirnov; SLM, stratum lacunosum moleculare; SR, stratum radiatum; TG, transgenic; WT, wild type.
