Figure 4.

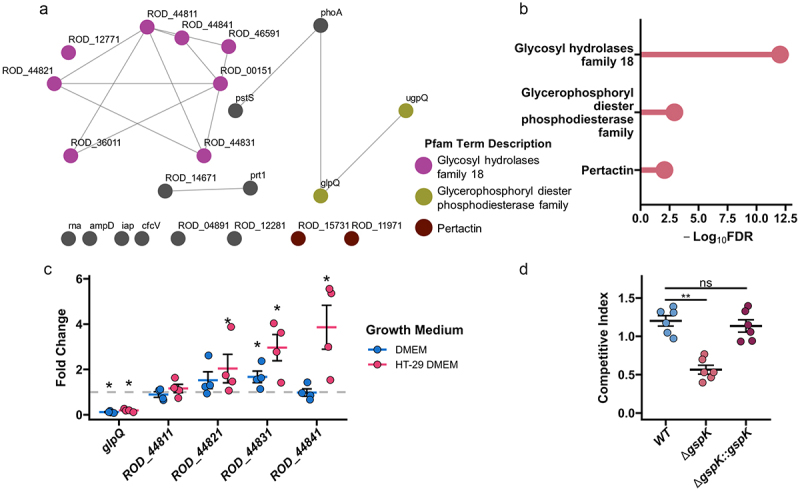
C. rodentium T2SS enables mucin degradation. (a) A network of association of the predicted T2SS effectors. A node-to-node connection indicates that the strength of association has passed a threshold confidence of 0.4 based on STRING analysis. Nodes are coloured based on the gene belonging to one of the statistically enriched pfam protein domains: magenta for “glycosyl hydrolases family 18”, olive for “glycerophosphoryl diester phosphodiesterase family”, brown for “pertactin”, and grey for not being enriched. (b) Lollipop plot showing significantly enriched domains among the predicted effectors. FDR is false discovery rate. (c) Selected T2SS gene expression changes calculated in C. rodentium cultured for 3 hours in either fresh DMEM or DMEM obtained following 2 days of HT-29-MTX culture using dnaQ and C. rodentium grown in LB media as reference. n = 4, Wilcoxon signed-rank test, error bars represent standard error of the mean. (d) Competitive index (CI) calculated via co-infection of intestinal epithelial cell line HT-29-MTX with either chloramphenicol-resistant isogenic WT, ΔgspK, or ΔgspK:gspK C. rodentium strains and WT C. rodentium. CI is indicative of the proportion of adherent bacteria belonging to each strain following a 4-hour infection period compared to the corresponding ratio of strains in the inoculating population. Kruskal-Wallis test followed by Dunn’s multiple comparisons test. n = 6.
