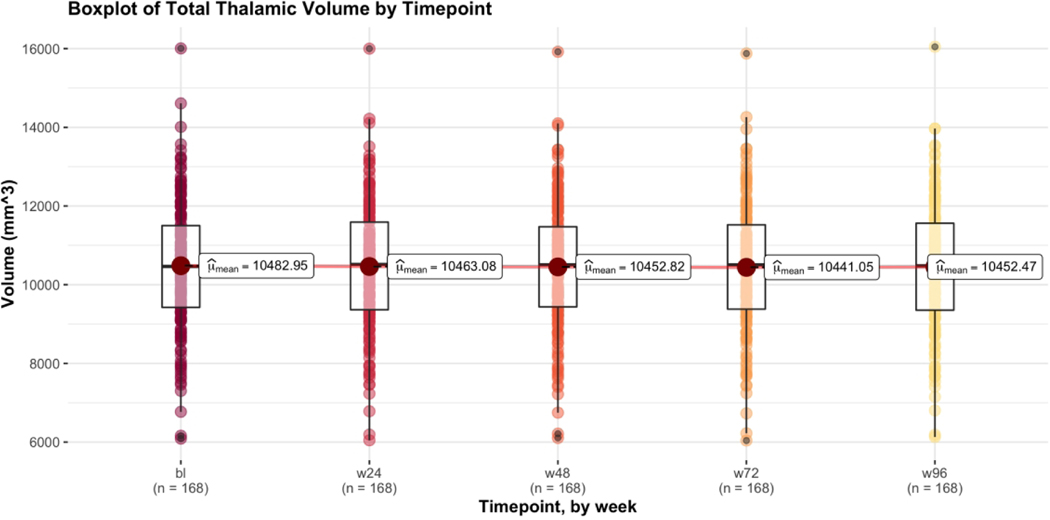
Figure 2.
Boxplot of Total Thalamic Volume by Timepoint. Plot was produced using mean within-subject’s total thalamic volume of all participants with MRI data from all 5 timepoints. Includes both treatment groups (Placebo n = 86, Ibudilast n = 82) and both MS subtypes (PPMS n = 90, SPMS n = 78). Compared to the intention to treat analysis, if a participant was missing any sequence that precluded the generation of an Enhanced T1 image, they were excluded from the 168 with data at all 5 timepoints. Due to missing data, 0 participants were excluded at baseline, 10 participants at week 24, 23 participants at week 48, 31 participants at week 72, and 31 participants at week 96.

