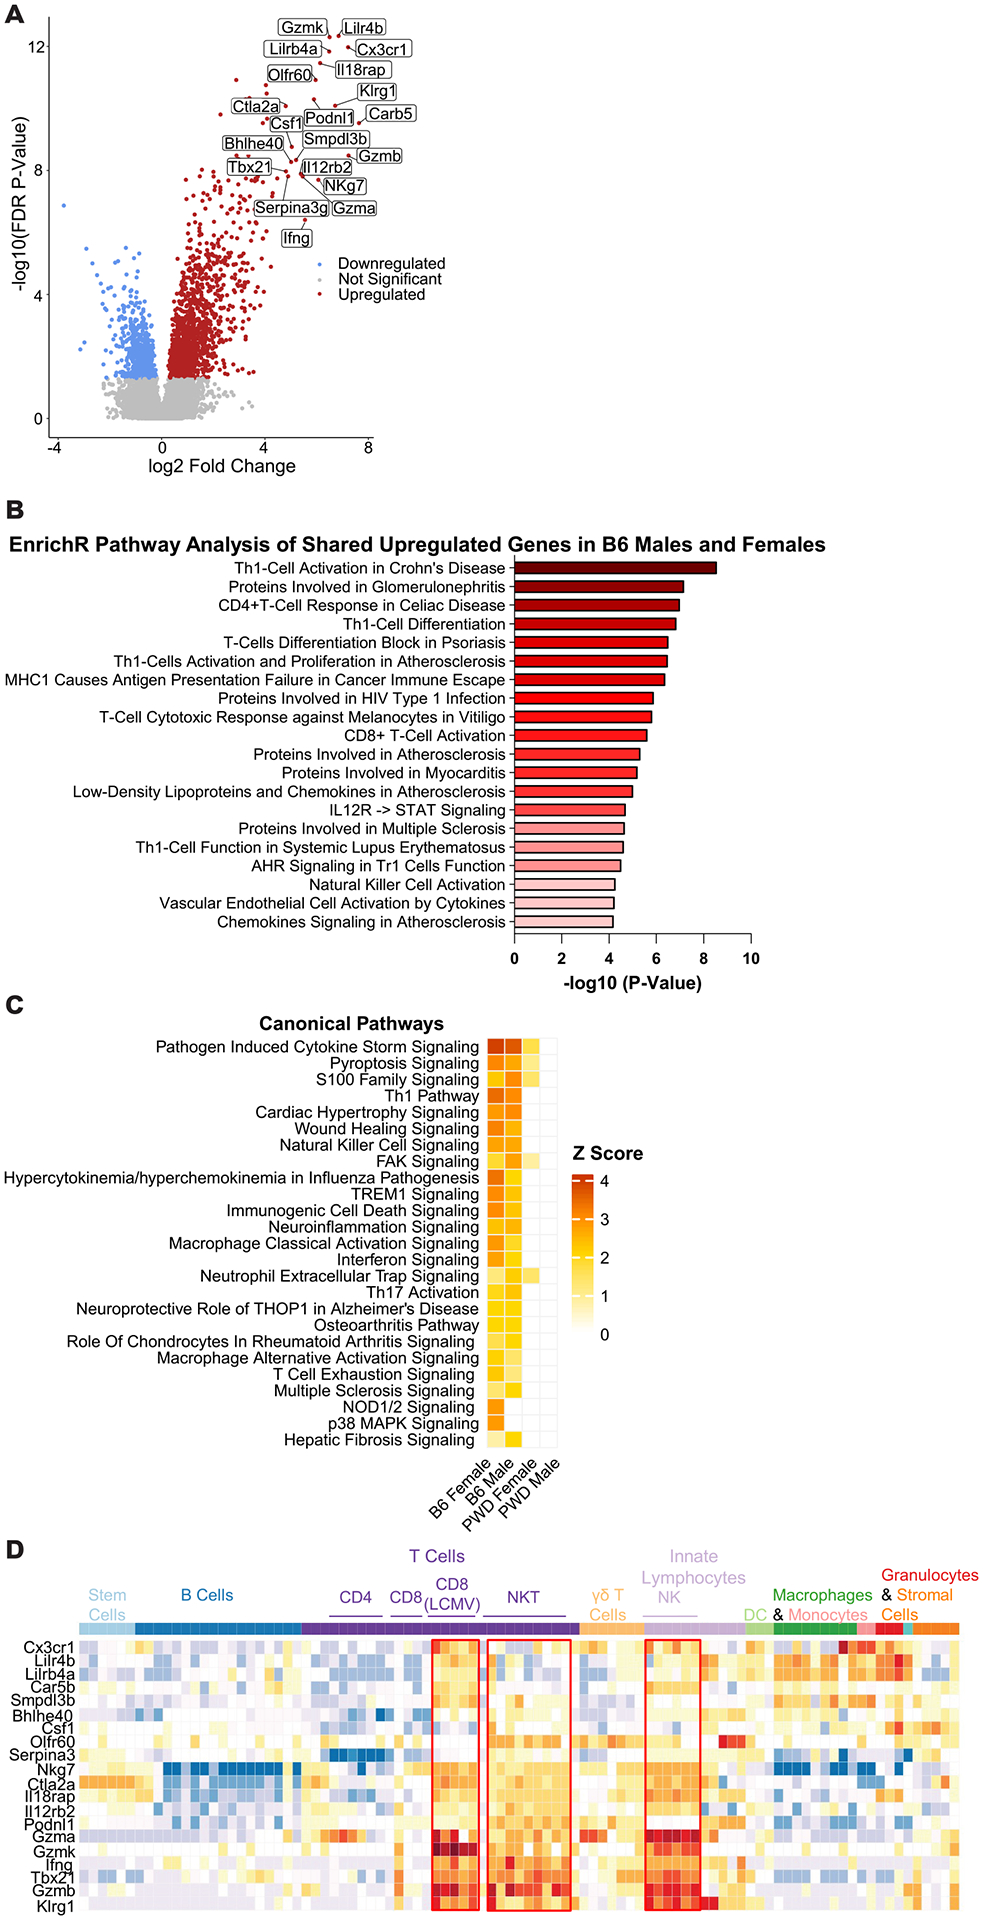
Figure 2. Latent MHV-68 infection generates a prominent cytotoxic signature in CD4 T cells in B6 mice.

Analysis of upregulated differentially expressed genes in CD4 T cells from B6 MHV-68 latently infected mice, as determined by transcriptional analysis described in Figure 1. (A) Volcano plot demonstrating upregulated genes passing the differential expression threshold (FDR <0.2 and FC |2|) in B6 females as a representative population. The top 20 upregulated genes by fold change are labeled. (B) Pathway analysis for all upregulated genes shared between B6 females and males, top 20 enriched pathways by P value as determined using Enrichr’s Elsevier Pathway Collection are shown (see Materials and Methods). (C) Pathway enrichment analysis of all differentially expressed genes to compare the effect of MHV-68 latency across the four genotype-sex combinations (B6 females, B6 males, PWD females, and PWD male) was conducted utilizing Ingenuity software (see Materials and Methods), top 25 enriched canonical pathways by Z score are shown. (D) Heatmap demonstrating the pattern of expression of the top 20 upregulated genes by fold change in B6 females as a representative population, across selected immune cell types of interest generated utilizing the ImmGen database and MyGeneSet tool (see Materials and Methods).
