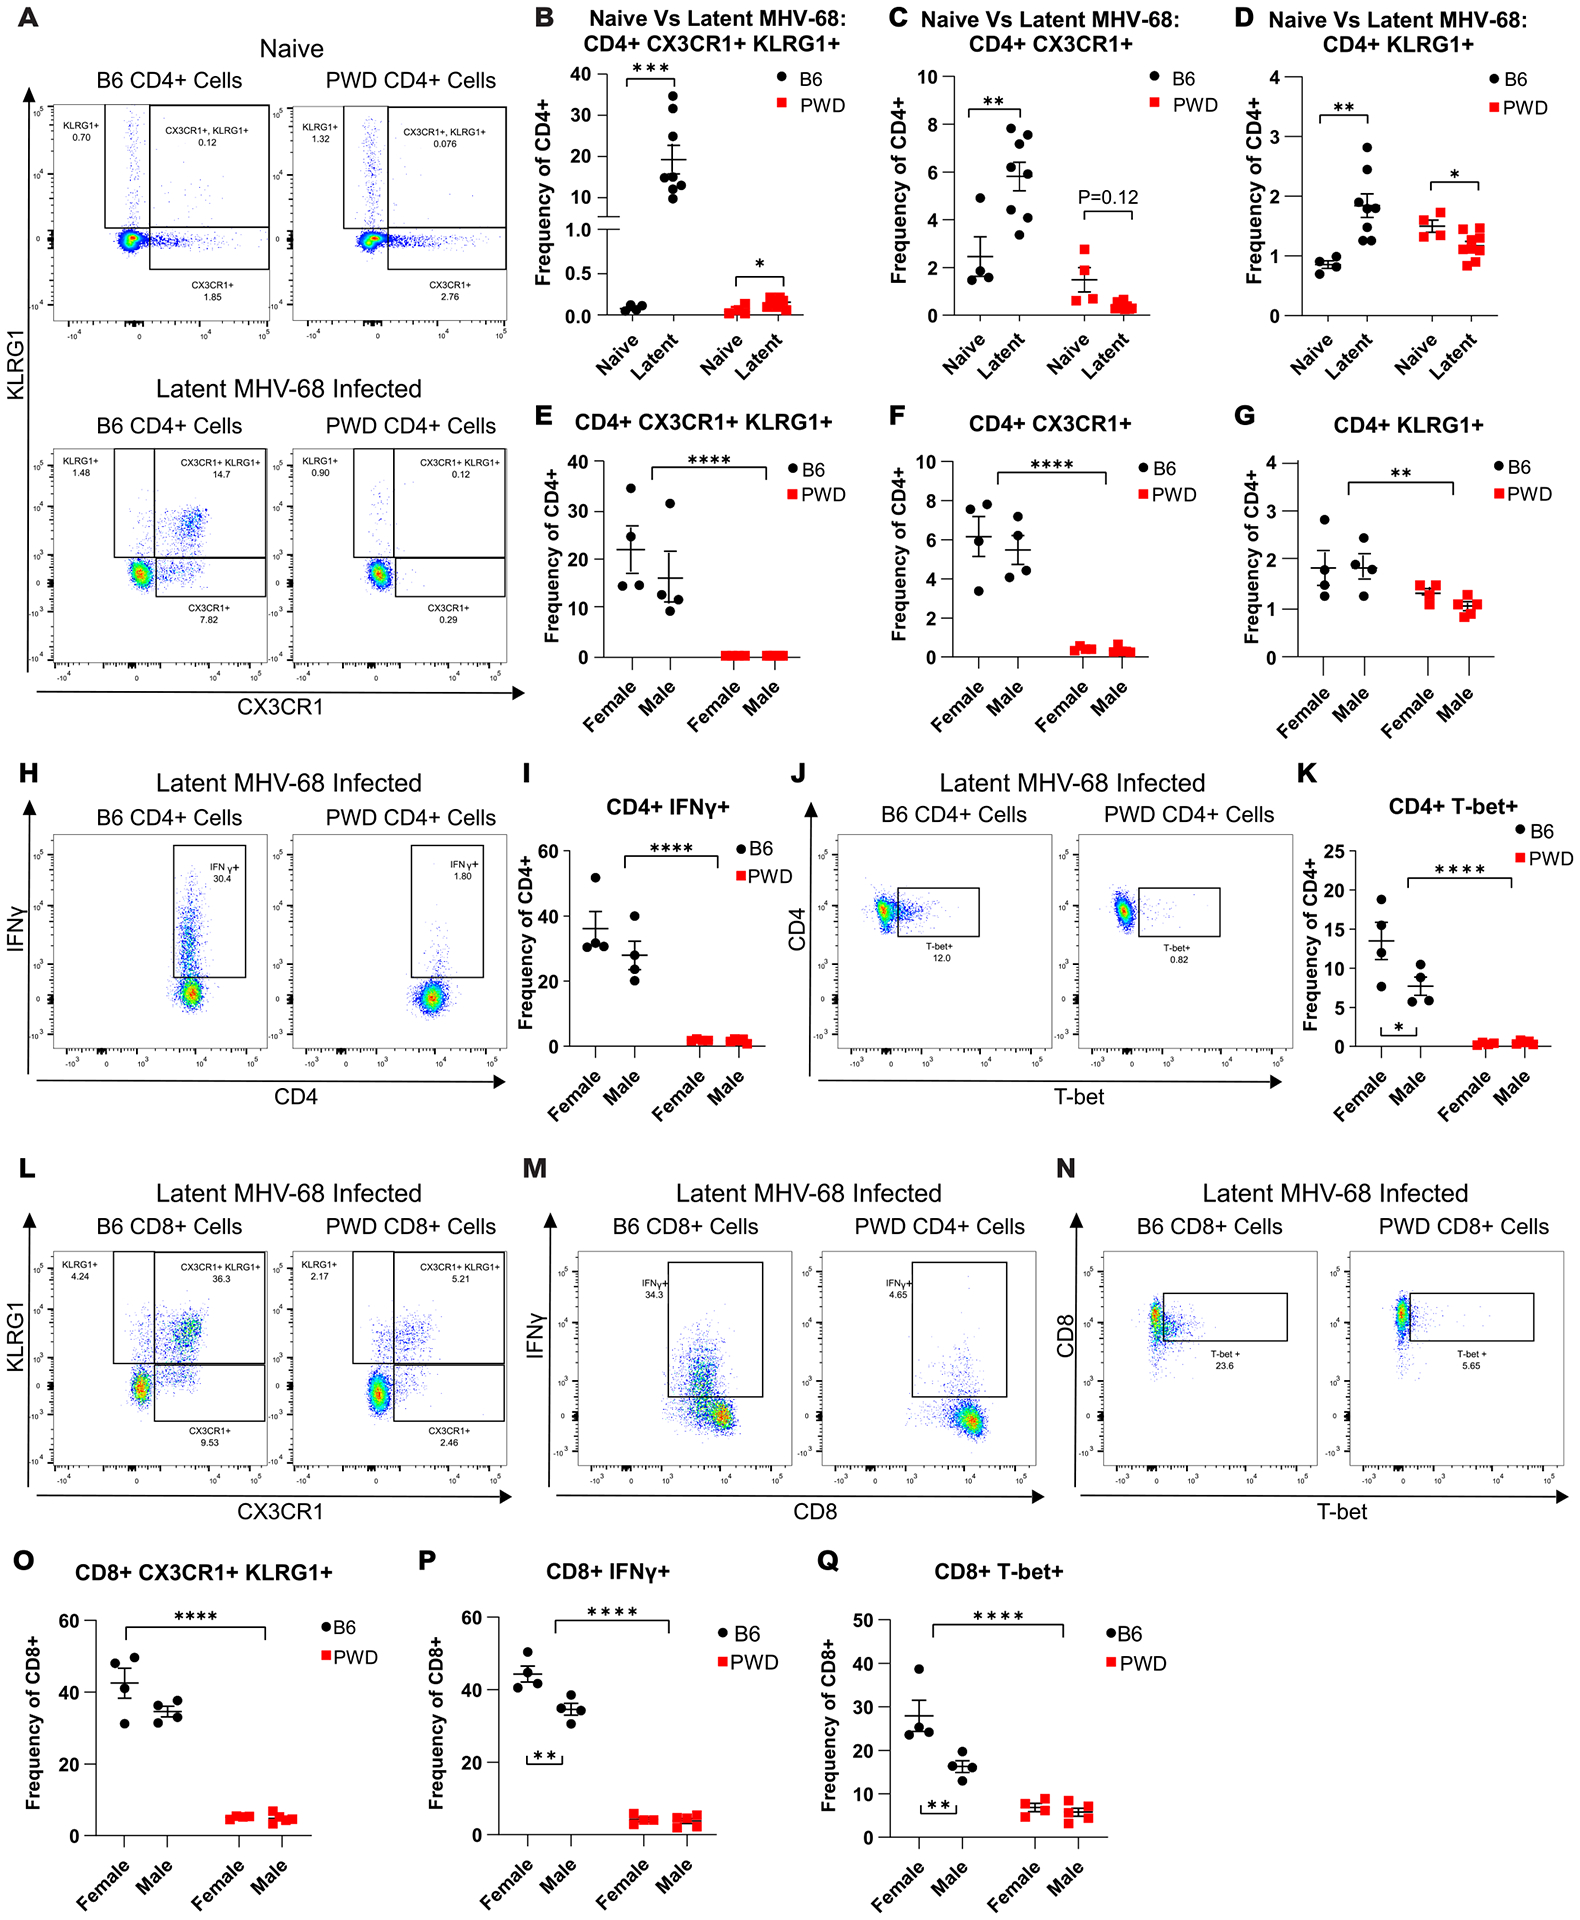
Figure 3. ThCTL cell expansion in latent MHV-68 is restricted to B6 mice.

6–8 week old female and male B6 (4F + 4M) and PWD (4F + 5M) mice were i.p. infected with MHV-68 as described in Figure 1. At 35 days post infection splenic leukocytes were isolated and flow cytometry was preformed to assess ThCTL abundance, using CX3CR1 and KLRG1 as surrogate markers (see Materials and Methods). (A-D) Representative CD4 T cell (CD4+TCRβ+CD11b−CD19−) staining profiles and corresponding summary scatterplots comparing CD4+ CX3CR1+KLRG1+ cell subsets from naïve (4 B6 and 4 PWD across two experiments) and latent MHV-68 infected B6 and PWD mice (B6 4F and 4M and PWD 4F and 4M). Significance of differences between naïve and latent timepoints within genotype was determined by unpaired T-tests, or Welch’s T-test in cases where the variance between groups was significantly different as calculated by an F test. Representative staining profiles and corresponding summary scatterplots of (E – G) CD4+ CX3CR1+KLRG1+, (H and I) CD4+IFNγ+ and (J and K) CD4+T-bet+ cell subsets from latent MHV-68 infected B6 and PWD mice. Representative staining profiles and corresponding scatterplots of CD8 T cell (CD8+TCRβ+CD11b−CD19−) subsets from latently MHV-68 infected B6 and PWD mice for CD8+CX3CR1+KLRG1+, CD8+IFNγ+, and CD8+T-bet+ (L-Q). Significance of differences between B6 and PWD genotypes, as well as differences between males and females within genotype, were determined by two-way ANOVA with Šídák’s multiple comparisons test. Comparisons are indicated by the brackets where significant (p<0.05).
